Pepsi 2008 Annual Report Download - page 7
Download and view the complete annual report
Please find page 7 of the 2008 Pepsi annual report below. You can navigate through the pages in the report by either clicking on the pages listed below, or by using the keyword search tool below to find specific information within the annual report.-
 1
1 -
 2
2 -
 3
3 -
 4
4 -
 5
5 -
 6
6 -
 7
7 -
 8
8 -
 9
9 -
 10
10 -
 11
11 -
 12
12 -
 13
13 -
 14
14 -
 15
15 -
 16
16 -
 17
17 -
 18
18 -
19
-
20
-
21
-
22
-
23
-
24
-
25
-
26
-
27
-
28
-
29
-
30
-
31
-
32
-
33
-
34
-
35
-
36
-
37
-
38
-
39
-
40
-
41
-
42
-
43
-
44
-
45
-
46
-
47
-
48
-
49
-
50
-
51
-
52
-
53
-
54
-
55
-
56
-
57
-
58
-
59
-
60
-
61
-
62
-
63
-
64
-
65
-
66
-
67
-
68
-
69
-
70
-
71
-
72
-
73
-
74
-
75
-
76
-
77
-
78
-
79
-
80
-
81
-
82
-
83
-
84
-
85
-
86
-
87
-
88
-
89
-
90
-
91
-
92
-
93
-
94
-
95
-
96
-
97
-
98
-
99
-
100
-
101
-
102
-
103
-
104
 |
 |

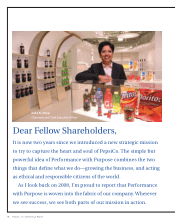
All over the world, whether it’s Cedar Rapids or
Calgary, Shanghai or São Paulo, Mexico City,
Moscow or Mumbai, our associates draw strength
and inspiration from this shared mission. This
year’s annual report brings some of their stories
to life. It shows how performance and purpose
combine to great effect in everything we do.
When times are tough it is especially important to
be clear about your mission. By any measure, 2008
was a year of extremes, an incredibly volatile year.
Easy credit turned into a credit crunch that left
many businesses and consumers strapped for cash.
The global economy lurched rapidly into recession. Oil
prices approached $150 a barrel before returning back
below $40. Corn, sugar, oats and other key commod-
ities saw signicant price swings throughout the year.
Global business was made harder by foreign exchange
rates that uctuated, at times wildly. The Dow Jones
Index began 2008 above 13,000 and ended the year
below 9,000. That dragged down even the strongest
companies’ stock—including PepsiCo shares.
All told, I can’t recall a more eventful or trying year.
Not that I think pessimism is in order. The ingenuity
of our company showed through again. All our teams
of extraordinary people applied their can-do spirit and
must-do sense of responsibility to meet the economic
and market challenges head on.
As a result, PepsiCo performed slightly better for
the year than both the Dow Jones Industrial Average
and the S&P 500. I believe that’s because, while we
can’t control market volatility, we remained focused
on our strategies for growth, and that is why our
underlying businesses continued to perform very
well in 2008.
We increased our dividend, continued our share
repurchase program and positioned ourselves for
even stronger performance as economic conditions
improve.
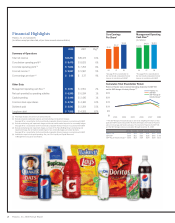
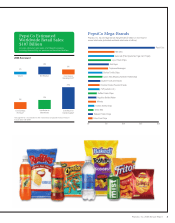
• Net revenue grew 10%.
• Core division operating prot grew 6%.*
• Cash ow from operations was $7 billion.
• Core return on invested capital was 29%.
• Core EPS grew 9%.*
In PepsiCo Americas Foods we had another year
of strong growth to both the top and the bottom lines.
That is testament to our strong brands and our efcient
go-to-market systems. This year brought unprece-
dented cost ination, but we carefully adjusted our
pricing and the weights and package formats across
our brands to nd the right solution for each channel,
each market, each customer and each consumer.
The year presented some other unexpected problems
that we coped with well. Our agship Quaker plant in
Cedar Rapids, Iowa, experienced a major ood but
returned to normal production levels by year-end. In
Latin America, our Brazil snacks business overcame a
re at one of our major plants to perform really well.
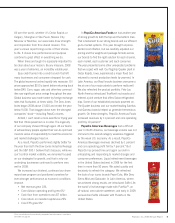
We also refreshed the product portfolio. Frito-Lay
North America introduced TrueNorth nut snacks and
entered a joint venture that offers Sabra refrigerated
dips. Some of our established products powered on.
The Quaker business and our market-leading Sabritas
and Gamesa brands helped us generate tremendous
growth. On these strengths, PepsiCo Americas Foods
increased revenues by 11 percent and core operating
prot by 10 percent.*
PepsiCo Americas Beverages had a difcult
year. In North America, our beverage volume was not
immune to the overall category weakness triggered
by the weak U.S. economy. As a result, PepsiCo
Americas Beverages revenues declined by 1 percent
and core operating prot fell by 7 percent.* But
PepsiCo has proved time and again our skill in
anticipating and responding to market changes and
consumer preferences. Liquid refreshment beverages
in the United States declined in 2008 for the rst
time in more than 50 years. We acted quickly and
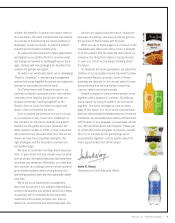
decisively to refresh the category. We refreshed
the look of our iconic brands Pepsi-Cola, Mtn Dew,
Sierra Mist and Gatorade. In Latin America, where
we achieved strong results, we introduced SoBe Life,
the world’s rst beverage made with PureViaTM, an
all-natural, zero-calorie sweetener; and early in 2009,
we launched SoBe Lifewater with PureVia in the
United States.
*Forareconciliationtothemostdirectlycomparablenancialmeasureinaccordance
with GAAP, see page 95. 5PepsiCo, Inc. 2008 Annual Report