Pepsi 2008 Annual Report Download - page 4
Download and view the complete annual report
Please find page 4 of the 2008 Pepsi annual report below. You can navigate through the pages in the report by either clicking on the pages listed below, or by using the keyword search tool below to find specific information within the annual report.-
 1
1 -
 2
2 -
 3
3 -
 4
4 -
 5
5 -
 6
6 -
 7
7 -
 8
8 -
 9
9 -
 10
10 -
 11
11 -
 12
12 -
 13
13 -
 14
14 -
 15
15 -
16
-
17
-
18
-
19
-
20
-
21
-
22
-
23
-
24
-
25
-
26
-
27
-
28
-
29
-
30
-
31
-
32
-
33
-
34
-
35
-
36
-
37
-
38
-
39
-
40
-
41
-
42
-
43
-
44
-
45
-
46
-
47
-
48
-
49
-
50
-
51
-
52
-
53
-
54
-
55
-
56
-
57
-
58
-
59
-
60
-
61
-
62
-
63
-
64
-
65
-
66
-
67
-
68
-
69
-
70
-
71
-
72
-
73
-
74
-
75
-
76
-
77
-
78
-
79
-
80
-
81
-
82
-
83
-
84
-
85
-
86
-
87
-
88
-
89
-
90
-
91
-
92
-
93
-
94
-
95
-
96
-
97
-
98
-
99
-
100
-
101
-
102
-
103
-
104
 |
 |

$0
$50
$100
$150
$200
$250
2003 2004 2005 2006 2007 2008
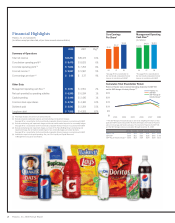
2008 2007 Chg(a)
Summary of Operations
Total net revenue $43,251 $39,474 10%
Core division operating prot (b) «$««8,475 $««8,025 6%
Core total operating prot (c) $««7,824 $««7,253 8%
Core net income (d) $««5,887 $««5,587 5%
Core earnings per share (d) $««÷3.68 $««÷3.37 9%
Other Data
Management operating cash ow (e) $««4,651 $««4,551 2%
Net cash provided by operating activities $««6,999 $««6,934 1%
Capital spending $««2,446 $««2,430 1%
Common share repurchases $««4,720 $««4,300 10%
Dividends paid $««2,541 $««2,204 15%
Long-term debt $««7,858 $««4,203 87%
(a) Percentage changes are based on unrounded amounts.
(b) Excludes corporate unallocated expenses and restructuring and impairment charges.
Seepage95forareconciliationtothemostdirectlycomparablenancialmeasureinaccordancewithGAAP.
(c) Excludes restructuring and impairment charges and the net mark-to-market impact of our commodity hedges.
Seepage95forareconciliationtothemostdirectlycomparablenancialmeasureinaccordancewithGAAP.
(d) Excludesrestructuringandimpairmentcharges,ourshareofThePepsiBottlingGroup’srestructuringand
impairment charge, the net mark-to-market impact of our commodity hedges and certain tax items.
Seepage95forareconciliationtothemostdirectlycomparablenancialmeasureinaccordancewithGAAP.
(e) Includestheimpactofnetcapitalspending.Also,see“OurLiquidityandCapitalResources”
inManagement’sDiscussionandAnalysis.
Financial Highlights
PepsiCo,Inc.andsubsidiaries
(in millions except per share data; all per share amounts assume dilution)
06
Core Earnings
Per Share*
Management Operating
Cash Flow**
(in millions)
08
07 08 0706
*See page 95 for a reconciliation to
themostdirectlycomparablenancial
measureinaccordancewithGAAP.
**See page 95 for a reconciliation to
themostdirectlycomparablenancial
measureinaccordancewithGAAP.
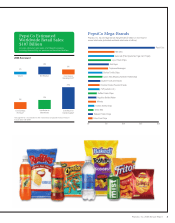
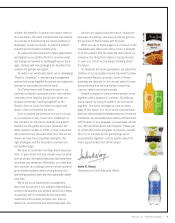
Cumulative Total Shareholder Return
Return on PepsiCo stock investment (including dividends), the S&P 500
and the S&P Average of Industry Groups.*** PepsiCo, Inc.
S&P 500®
S&P® Average of
Industry Groups***
***TheS&PAverageofIndustryGroupsisderivedbyweightingthereturnsoftwo
applicableS&PIndustryGroups(Non-AlcoholicBeveragesandFood)byPepsiCo’s
salesinitsbeverageandfoodsbusinesses.ThereturnsforPepsiCo,theS&P500,
andtheS&PAverageindicesarecalculatedthroughDecember31,2008.
Dec-03 Dec-04 Dec-05 Dec-06 Dec-07 Dec-08
PepsiCo, Inc. $100 $114 $131 $141 $175 $130
S&P 500® $100 $111 $116 $135 $142 $ 90
S&P® Avg. of Industry Groups*** $100 $110 $107 $124 $138 $113
$3.01
$3.37
$3.68
$4,065
$4,551 $4,651
2PepsiCo, Inc. 2008 Annual Report