Office Depot 2002 Annual Report Download - page 45
Download and view the complete annual report
Please find page 45 of the 2002 Office Depot annual report below. You can navigate through the pages in the report by either clicking on the pages listed below, or by using the keyword search tool below to find specific information within the annual report.-
 1
1 -
2
-
3
-
4
-
5
-
6
-
7
-
8
-
9
-
10
-
11
-
12
-
13
-
14
-
15
-
16
-
17
-
18
-
19
-
20
-
21
-
22
-
23
-
24
-
25
-
26
-
27
-
28
-
29
-
30
-
31
-
32
-
33
-
34
-
 35
35 -
 36
36 -
 37
37 -
 38
38 -
 39
39 -
 40
40 -
 41
41 -
 42
42 -
 43
43 -
 44
44 -
 45
45 -
 46
46 -
 47
47 -
 48
48
 |
 |

Office Depot, Inc. and Subsidiaries
43
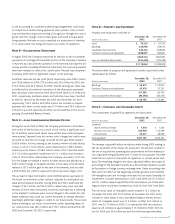
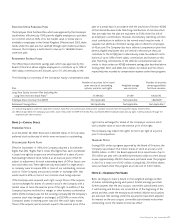
Senior management evaluates the performance of each business segment
based on segment operating profit, which is defined as sales less cost of
sales, store and warehouse operating expenses, and facility closure costs.
General and administrative expenses, financing costs and certain other
items are not allocated to the business segments because they are viewed
as corporate functions that support all activities and the cost of alloca-
tion would exceed the benefit received. A reconciliation of the measure
of segment operating profit to consolidated earnings from continuing
operations before income taxes follows.
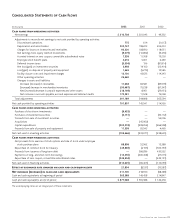
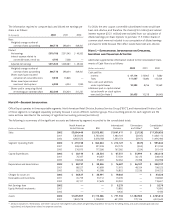
(Dollars in thousands)
2002 2001 2000
Segment operating profit $995,842 $811,032 $561,419
(Add)/subtract:
General and administrative expenses 486,279 445,538 447,693
Other operating expenses 9,855 12,125 6,733
Interest expense, net 27,686 30,359 21,338
Miscellaneous (income) expense (7,183) 9,057 (4,632)
Earnings from continuing
operations before income taxes $479,205 $313,953 $ 90,287
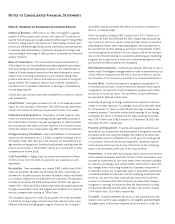
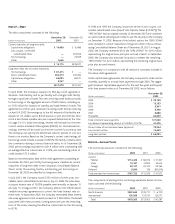
The Company sells office products and services through either wholly owned operations or through joint ventures or licensing arrangements, in
Austria, Belgium, Canada, Costa Rica, France, Germany, Guatemala, Hungary, Ireland, Israel, Italy, Japan, Luxembourg, Mexico, the Netherlands, Poland,
Portugal, Spain, Switzerland, Thailand, the United Kingdom and the United States. There is no single country outside of the United States in which we
generate 10% or more of our total revenues. Geographic financial information relating to our business is as follows.
Sales Long-Lived Assets
(Dollars in thousands) 2002 2001 2000 2002 2001
United States $ 9,575,457 $ 9,452,453 $ 9,901,975 $ 874,247 $ 913,987
International 1,781,176 1,629,659 1,593,518 243,815 185,631
Total $11,356,633 $11,082,112 $11,495,493 $1,118,062 $1,099,618
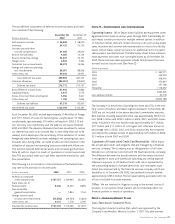
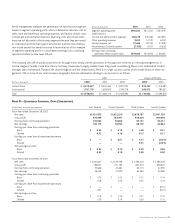
Note N—Quarterly Financial Data (Unaudited)
(In thousands, except per share amounts) First Quarter Second Quarter Third Quarter Fourth Quarter
Fiscal Year Ended December 28, 2002
Net sales $3,021,873 $2,622,259 $2,870,781 $2,841,720
Gross profit 876,096 763,397 850,429 844,048
Earnings from continuing operations 102,062 56,869 87,131 65,421
Net earnings 102,710 56,943 88,172 62,883
Earnings per share from continuing operations:
Basic $ 0.34 $ 0.18 $ 0.28 $ 0.21
Diluted 0.32 0.18 0.27 0.21
Earnings per share from discontinued operations:
Basic $ — $ 0.01 $ 0.01 $ (0.01)
Diluted — — 0.01 (0.01)
Net earnings per share:
Basic $ 0.34 $ 0.19 $ 0.29 $ 0.20
Diluted 0.32 0.18 0.28 0.20
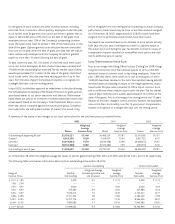
Fiscal Year Ended December 29, 2001
Net sales $ 3,001,827 $ 2,534,558 $ 2,763,318 $ 2,782,409
Gross profit 799,941 731,194 801,079 809,831
Earnings from continuing operations 55,668 41,381 62,113 42,495
Net earnings 56,329 41,974 62,460 40,280
Earnings per share from continuing operations:
Basic $ 0.19 $ 0.14 $ 0.21 $ 0.14
Diluted 0.18 0.14 0.20 0.14
Earnings per share from discontinued operations:
Basic $ — $ — $ — $ (0.01)
Diluted 0.01 — — (0.01)
Net earnings per share:
Basic $ 0.19 $ 0.14 $ 0.21 $ 0.13
Diluted 0.19 0.14 0.20 0.13