Office Depot 2002 Annual Report Download - page 17
Download and view the complete annual report
Please find page 17 of the 2002 Office Depot annual report below. You can navigate through the pages in the report by either clicking on the pages listed below, or by using the keyword search tool below to find specific information within the annual report.-
 1
1 -
2
-
3
-
4
-
5
-
6
-
 7
7 -
 8
8 -
 9
9 -
 10
10 -
 11
11 -
 12
12 -
 13
13 -
 14
14 -
 15
15 -
 16
16 -
 17
17 -
 18
18 -
 19
19 -
 20
20 -
 21
21 -
 22
22 -
 23
23 -
 24
24 -
 25
25 -
 26
26 -
 27
27 -
28
-
29
-
30
-
31
-
32
-
33
-
34
-
35
-
36
-
37
-
38
-
39
-
40
-
41
-
42
-
43
-
44
-
45
-
46
-
47
-
48
 |
 |

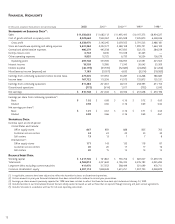
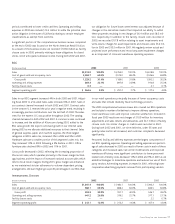
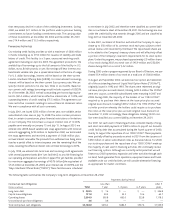
Overall
(Dollars in millions) 2002 2001 2000
Sales $11,356.6 100.0% $11,082.1 100.0% $11,495.5 100.0%
Cost of goods sold and occupancy costs 8,022.7 70.6% 7,940.1 71.6% 8,435.9 73.4%
Gross profit 3,333.9 29.4% 3,142.0 28.4% 3,059.6 26.6%
Store and warehouse operating and selling expenses 2,331.4 20.5% 2,322.6 21.0% 2,388.1 20.8%
Facility closure costs 6.7 0.1% 8.4 0.1% 110.0 0.9%
Segment operating profit 995.8 8.8% 811.0 7.3% 561.5 4.9%
General and administrative expenses 486.3 4.3% 445.5 4.0% 447.8 3.9%
Other operating expenses 9.8 0.1% 12.1 0.1% 6.7 0.1%
Operating profit $ 499.7 4.4% $ 353.4 3.2% $ 107.0 0.9%
Office Depot, Inc. and Subsidiaries
15
Our overall sales increased 2% in 2002 after a decrease of 4% in 2001.
Fiscal year 2000 included 53 weeks in accordance with our 52–53 week
fiscal year. Adjusting 2000 to a 52-week basis, sales decreased 2% in
2001. Sales from our International Division and our Business Services
Group increased each year, while sales in our North American Retail
Division declined. Comparable sales in our North American Retail Division,
measured as sales from stores that have been open for one year or
more, decreased 2% in both 2002 and 2001. This decline reflects con-
tinued softness in small business and consumer purchases of office
products and an overall slowdown in the domestic economy. Addition-
ally, the decline in sales for our North American Retail Division reflects,
in part, our decision to close 73 stores during 2001, following our com-
prehensive business review performed in the latter part of 2000. The
increase in 2002 sales for our BSG segment results from strengthening
in our contract business, partially offset by weaker catalog sales.
Worldwide e-commerce sales have improved in all periods, increasing
to $2.1 billion in 2002 from $1.6 billion in 2001.
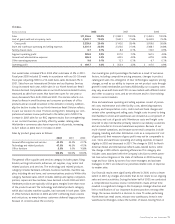
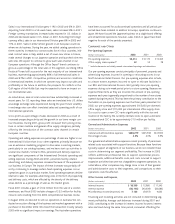
Sales by product group were as follows:
2002 2001 2000
General office supplies and services 43.2% 44.2% 41.7%
Technology and related products 47.9% 46.3% 47.5%
Office furniture 8.9% 9.5% 10.8%
100.0% 100.0% 100.0%
The general office supplies and services category includes paper, filing,
binders, writing instruments, adhesives, art supplies, copy center and
related products and services. The technology and related products
category includes hardware, software, business machines, machine sup-
plies, including ink and toner, and communications products. Within this
category, hardware sales, which includes desktop and laptop computers,
printers, copiers and fax machines, have declined in both 2002 and 2001.
Hardware products are typically sold at gross margins lower than most
of the products we sell. The technology and related products category,
which also includes machine supplies, has increased in both years. Sales
of office furniture declined in 2002 and 2001, reflecting lower volume
and unit prices, as many business customers deferred large purchases
because of concerns about the economy.
Our overall gross profit percentages fluctuate as a result of numerous
factors, including competitive pricing pressures, changes in product,
catalog and sales mix, emergence of new technologies, suppliers’ pricing
changes, as well as our ability to improve our net product costs through
growth in total merchandise purchases. Additionally, our occupancy costs
may vary as we add stores and CSCs in new markets with different rental
and other occupancy costs, and as we relocate and/or close existing
stores in current markets.
Store and warehouse operating and selling expenses consist of person-
nel costs, maintenance and other facility costs, advertising expenses,
delivery and transportation costs, credit card and bank charges and
certain other operating and selling costs. Freight costs incurred to bring
merchandise to stores and warehouses are included as a component of
inventory and cost of goods sold. Warehouse costs and freight costs
incurred to ship merchandise primarily relate to our delivery customers
and are included in store and warehouse expenses. Because of our
multi-channel operations, and because some retail companies include
shipping, handling and other distribution costs as a component of cost
of goods sold, their measure of gross profit may not be comparable to
ours. Store and warehouse operating and selling expenses increased
slightly in 2002 and decreased in 2001. The change in 2002 for North
American Retail and International reflects sales-related factors, while
the change in BSG reflects operating efficiencies. This category also
includes costs associated with the Company’s decision to settle poten-
tial class action litigation in the state of California in 2002 involving
wage and hour claims by some of our store managers and assistant
managers. In 2001, we reduced our personnel-related costs in response
to weaker sales.
Our financial results were significantly affected in 2000, and to a lesser
extent in 2001, by charges and credits that do not relate to our ongoing
sales and service activities. During the latter half of 2000, we conducted
a comprehensive business review. Commitments made at that time
resulted in a significant change in the Company’s strategic direction and
led to modifications of our important business practices. Among other
things, the review resulted in a decision to close 70 under-performing
North American retail stores, relocate two warehouses, invest in new
warehouse technologies, reduce the number of slower-moving SKUs in