Office Depot 2002 Annual Report Download - page 14
Download and view the complete annual report
Please find page 14 of the 2002 Office Depot annual report below. You can navigate through the pages in the report by either clicking on the pages listed below, or by using the keyword search tool below to find specific information within the annual report.-
 1
1 -
2
-
3
-
 4
4 -
 5
5 -
 6
6 -
 7
7 -
 8
8 -
 9
9 -
 10
10 -
 11
11 -
 12
12 -
 13
13 -
 14
14 -
 15
15 -
 16
16 -
 17
17 -
 18
18 -
 19
19 -
 20
20 -
 21
21 -
 22
22 -
 23
23 -
 24
24 -
25
-
26
-
27
-
28
-
29
-
30
-
31
-
32
-
33
-
34
-
35
-
36
-
37
-
38
-
39
-
40
-
41
-
42
-
43
-
44
-
45
-
46
-
47
-
48
 |
 |

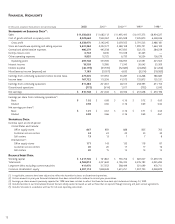
(In thousands, except per share amounts and statistical data) 2002 2001(1) 2000(1)(5) 1999(1) 1998(1)
Statements of Earnings Data(2):
Sales $11,356,633 $11,082,112 $11,495,493 $10,197,373 $8,934,227
Cost of goods sold and occupancy costs 8,022,663 7,940,067 8,435,928 7,405,870 6,448,046
Gross profit 3,333,970 3,142,045 3,059,565 2,791,503 2,486,181
Store and warehouse operating and selling expenses 2,331,384 2,322,577 2,388,108 1,999,791 1,664,100
General and administrative expenses 486,279 445,538 447,693 322,172 284,239
Facility closure costs 6,744 8,436 110,038 40,425 —
Other operating expenses 9,855 12,125 6,733 16,524 136,279
Operating profit 499,708 353,369 106,993 412,591 401,563
Interest income 18,509 12,980 11,345 30,043 25,309
Interest expense (46,195) (43,339) (32,683) (24,852) (21,202)
Miscellaneous income (expense), net 7,183 (9,057) 4,632 (3,514) (18,985)
Earnings from continuing operations before income taxes 479,205 313,953 90,287 414,268 386,685
Income taxes 167,722 112,296 41,972 155,875 155,531
Earnings from continuing operations 311,483 201,657 48,315 258,393 231,154
Discontinued operations (775) (614) 1,017 (755) 2,042
Net earnings $ 310,708 $ 201,043 $ 49,332 $ 257,638 $ 233,196
Earnings per share from continuing operations(3):
Basic $ 1.02 $ 0.68 $ 0.16 $ 0.72 $ 0.63
Diluted 0.98 0.66 0.16 0.69 0.60
Net earnings per share(3):
Basic $ 1.01 $ 0.67 $ 0.16 $ 0.71 $ 0.64
Diluted 0.98 0.66 0.16 0.69 0.61
Statistical Data:
Facilities open at end of period:
United States and Canada:
Office supply stores 867 859 888 825 702
Customer service centers 24 24 25 30 30
Call centers 13 13 7 7 8
International(4):
Office supply stores 171 143 132 118 87
Customer service centers 20 20 17 17 16
Call centers 20 15 14 14 13
Balance Sheet Data:
Working capital $ 1,217,706 $ 721,867 $ 790,752 $ 687,007 $1,293,370
Total assets 4,765,812 4,331,643 4,196,334 4,276,183 4,025,283
Long-term debt, excluding current maturities 411,970 317,552 598,499 321,099 470,711
Common stockholders’ equity 2,297,112 1,848,438 1,601,251 1,907,720 2,028,879
(1) As applicable, amounts have been adjusted to reflect the Australian business as discontinued operations.
(2) Certain amounts in prior year financial statements have been reclassified to conform to current year presentation.
(3) Earnings per share amounts previously reported for 1998 have been restated to reflect the three-for-two stock split declared on February 24, 1999.
(4) Includes facilities in our International Division that are wholly owned or leased, as well as those that we operate through licensing and joint venture agreements.
(5) Includes 53 weeks in accordance with our 52–53 week reporting convention.
Financial Highlights
12