Office Depot 2002 Annual Report Download - page 20
Download and view the complete annual report
Please find page 20 of the 2002 Office Depot annual report below. You can navigate through the pages in the report by either clicking on the pages listed below, or by using the keyword search tool below to find specific information within the annual report.-
 1
1 -
2
-
3
-
4
-
5
-
6
-
7
-
8
-
9
-
 10
10 -
 11
11 -
 12
12 -
 13
13 -
 14
14 -
 15
15 -
 16
16 -
 17
17 -
 18
18 -
 19
19 -
 20
20 -
 21
21 -
 22
22 -
 23
23 -
 24
24 -
 25
25 -
 26
26 -
 27
27 -
 28
28 -
 29
29 -
 30
30 -
31
-
32
-
33
-
34
-
35
-
36
-
37
-
38
-
39
-
40
-
41
-
42
-
43
-
44
-
45
-
46
-
47
-
48
 |
 |

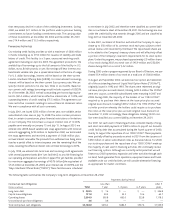
Sales in our International Division grew 11% in 2002 and 6% in 2001.
Adjusting fiscal 2000 to a 52-week basis, sales increased 8% in 2001.
Foreign currency translations increased sales reported in U.S. dollars in
2002 and decreased sales in U.S. dollars in 2001. Excluding the foreign
currency effect, sales in our International Division grew 6% in 2002 and
11% in 2001. Sales in 2002 reflect growth in all European countries
where we do business. During the year, we added catalog operations in
three countries, increased our contract sales force in four countries, initi-
ated contract sales in Italy, added a net of seven new stores in France,
made several changes to our Japanese operation and launched nine new
web sites. We expect to continue to grow each sales channel in our
European operations. Although the Office Depot姞brand continues to
grow as a percentage of the total sales in this segment, our Viking Office
Products姞brand still accounts for the vast majority of our international
business, representing approximately 86% of all international sales in
2002 and 87% in 2001. Competitive, political, and economic conditions
in international markets in which we operate may impact our sales and
profitability in the future. In addition, the prospects for conflicts in the
Gulf region of the Middle East may be expected to have an impact on
our international sales.
As noted above, sales in local currencies have substantially increased in
recent years. For U.S. reporting, these sales are translated into U.S. dollars
at average exchange rates experienced during the year. Future volatility
in exchange rates can affect translated sales and operating profit of our
International operations.
Gross profit as a percentage of sales decreased in 2002 as a result of
increased prospecting activity and the growth in our lower margin con-
tract business. During 2001, gross profit increased from pricing initia-
tives in certain machine and general office supply categories, partially
offset by the introduction of the contract sales channel in certain
European countries.
Operating and selling expenses as a percentage of sales are higher in our
International Division than in our other segments primarily because we
use an extensive marketing program to drive sales in existing markets,
particularly in our catalog business, and we have start-up activities in
several new markets. Similar to BSG, personnel and delivery expenses
are significant components of the International Division’s operating and
selling expenses. During 2002 and 2001, personnel, facility-related,
advertising, and delivery expenses increased because of the expansion of
our business in Europe. The impact of these increases was partially off-
set by continuing to leverage certain fixed operating expenses. As our
operations grow in a particular market, fixed operating expenses decline
relative to sales. For example, advertising costs in the form of prospecting
and delivery costs, which are affected by the density of the delivery
areas, decline as a percentage of sales as the market grows.
Fiscal 2001 includes a gain of $10.2 million from the sale of a London
warehouse, and fiscal 2000 includes charges of $2.2 million for facility
closure costs resulting from the 2000 comprehensive business review.
In August 2002, we decided to sell our operations in Australia. We con-
ducted an auction offering of the business and reached agreement with a
purchaser in December 2002. We closed the transaction in early January
2003 with no significant impact on earnings. The Australian operations
have been accounted for as discontinued operations and all periods pre-
sented have been restated. In addition to Europe, operations continue in
Japan. We have focused the Japanese business on a single brand offering
and streamlined operations; however, sales trends in Japan have been
negative for each of the periods presented.
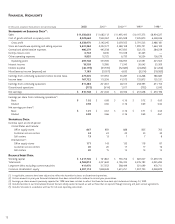
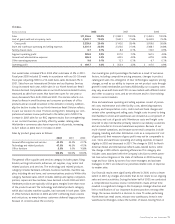
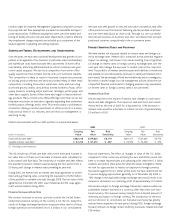
Corporate and Other
Pre-Opening Expenses
(Dollars in thousands) 2002 2001 2000
Pre-opening expenses $8,414 $10,172 $13,465
Office supply stores opened* 42 55 78
* Includes domestic and wholly owned international openings and relocations.
Our pre-opening expenses consist principally of personnel, property and
advertising expenses incurred in opening or relocating stores in our
North American Retail Division. Our pre-opening expenses also include,
to a lesser extent, expenses incurred to open or relocate facilities in
our BSG and International Division. We typically incur pre-opening
expenses during a six-week period prior to a store opening. Because we
expense these items as they are incurred, the amount of pre-opening
expenses each year is generally proportional to the number of new stores
opened during the period. This has been the primary contribution to the
fluctuation in pre-opening expenses over the three years presented. For
2002, our pre-opening expenses approximated $165,000 per domestic
office supply store and $115,000 per international office supply store.
Our cost to open a new CSC varies significantly with the size and
location of the facility. We currently estimate costs to open a domestic
or international CSC to be approximately $1.0 million per facility.
General and Administrative Expenses
(Dollars in thousands) 2002 2001 2000
General and administrative expenses $486,279 $445,538 $447,693
Percentage of sales 4.3% 4.0% 3.9%
Our general and administrative expenses consist primarily of personnel-
related costs associated with support functions. Because these functions
typically support all segments of our business, we do not consider these
costs in determining our segment profitability. The increase in 2002
reflects additional professional fees to support operational process
improvements, additional benefits costs, and costs incurred to support
expansion activities that were not chargeable to segment operations. As
noted above, other companies may charge more or less of their general
and administrative costs to their segments, and comparisons to their
operations could be affected.
Other Income and Expense
(Dollars in thousands) 2002 2001 2000
Interest income $ 18,509 $ 12,980 $ 11,345
Interest expense (46,195) (43,339) (32,683)
Miscellaneous income (expense), net 7,183 (9,057) 4,632
Financing and investing activities are not included in determining seg-
ment profitability. Average cash balances increased during 2001 and
2002, contributing to the increase in interest income; however, interest
rates declined during the same time period, somewhat offsetting the