Office Depot 2002 Annual Report Download - page 19
Download and view the complete annual report
Please find page 19 of the 2002 Office Depot annual report below. You can navigate through the pages in the report by either clicking on the pages listed below, or by using the keyword search tool below to find specific information within the annual report.-
 1
1 -
2
-
3
-
4
-
5
-
6
-
7
-
8
-
 9
9 -
 10
10 -
 11
11 -
 12
12 -
 13
13 -
 14
14 -
 15
15 -
 16
16 -
 17
17 -
 18
18 -
 19
19 -
 20
20 -
 21
21 -
 22
22 -
 23
23 -
 24
24 -
 25
25 -
 26
26 -
 27
27 -
 28
28 -
 29
29 -
30
-
31
-
32
-
33
-
34
-
35
-
36
-
37
-
38
-
39
-
40
-
41
-
42
-
43
-
44
-
45
-
46
-
47
-
48
 |
 |

periods contributed to lower credit card fees. Operating and selling
expenses in 2002 also include $14.4 million to settle the potential class
action litigation in the state of California relating to certain employee
classifications as exempt from overtime.
A significant portion of the comprehensive business review completed
at the end of 2000 was focused on the North American Retail Division.
As a result of the business review, we recorded $103.8 million as facility
closure costs in 2000, primarily relating to lease obligations for closed
stores, net of anticipated sublease income. During both 2002 and 2001,
our obligation for future lease commitments was adjusted because of
changes in the real estate market that impacted our ability to sublet
these properties resulting in net charges of $6.4 million and $8.5 mil-
lion, respectively. In addition to the facility closure costs recorded in
2000, we recorded $57.8 million relating to asset impairments and
write-downs. Charges for asset impairments and closures were $5.4 mil-
lion in 2002 and $35.2 million in 2001. We regularly review actual and
projected store performance and record any asset impairment charges
as a component of store and warehouse operating expenses.
Office Depot, Inc. and Subsidiaries
17
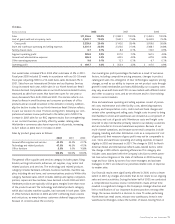
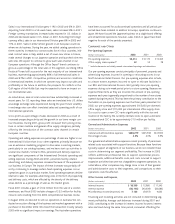
BSG
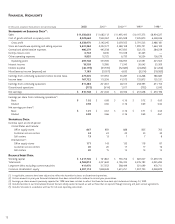
(Dollars in millions) 2002 2001 2000
Sales $3,913.9 100.0% $3,763.0 100.0% $3,618.8 100.0%
Cost of goods sold and occupancy costs 2,684.7 68.6% 2,574.0 68.4% 2,526.6 69.8%
Gross profit 1,229.2 31.4% 1,189.0 31.6% 1,092.2 30.2%
Operating and selling expenses 864.3 22.1% 897.8 23.9% 910.8 25.2%
Facility closure costs 0.3 — — — 4.1 0.1%
Segment operating profit $ 364.6 9.3% $ 291.2 7.7% $ 177.3 4.9%
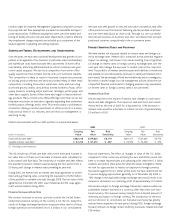
Sales in our BSG segment increased 4% in both 2002 and 2001. Adjust-
ing fiscal 2000 to a 52-week basis, sales increased 6% in 2001. Sales in
our contract channel increased in both 2002 and 2001. Contract sales
in the western U.S. reversed the prior year’s negative trend, resulting in
increasingly positive contributions over the last half of 2002. The sales
trend for the eastern U.S. was positive throughout 2002. The catalog
channel decreased in both 2002 and 2001. E-commerce sales continued
to increase, and the addition of 4Sure.com during 2001, added to the
BSG sales growth. We expect continued growth in our Internet sales
during 2003 as we allocate additional resources to that channel. Sales
of general supplies, paper, and machine supplies, the three largest
categories in BSG’s sales mix, increased 3% in 2002 and 9% in 2001.
Hardware sales are a smaller portion of this segment’s sales mix, but
they increased 10% in 2002 following a 5% decline in 2001. Office
furniture sales declined 8% in 2002 and 11% in 2001.
Gross profit decreased in 2002, reflecting the increasing proportion of
4Sure.com sales, which operates primarily in the lower margin technol-
ogy business, and the impact of increased national account sales which
tend to be at lower margins. During 2001, gross margin was enhanced
as we maintained stricter adherence to volume-dependent pricing
arrangements. We earn higher gross profit percentages in our BSG than
in our retail operations principally because of lower occupancy costs
and sales that include relatively fewer technology products.
The 2000 comprehensive business review also covered our BSG operations
and included a number of initiatives to improve delivery operations,
lower warehouse costs and improve customer satisfaction. Included in
fiscal year 2000 results are net charges of $10.9 million for inventory
adjustments and sales returns and allowances, and $4.1 million of facility
closure costs. No similar charges or credits were recorded in 2001.
During both 2002 and 2001, on-time deliveries, order fill rates and
quality index metrics all increased, and customer complaints decreased
significantly.
Personnel, facility and delivery expenses are the largest components of
our BSG operating expenses. Operating and selling expenses as a percent-
age of sales decreased in 2002 as a result of lower costs in each of these
categories and increased sales. Call center modifications and improved
warehouse efficiency were significant contributors to lower personnel-
related costs. Delivery costs decreased 13% in 2002 and 9% in 2001 as we
added technologies to streamline operations and reduced our use of third-
party vendors. Advertising expenses increased in 2001, reflecting lower
cooperative advertising payments received from participating vendors.
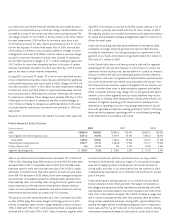
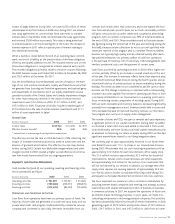
International Division
(Dollars in millions) 2002 2001 2000
Sales $1,641.4 100.0% $1,480.1 100.0% $1,393.2 100.0%
Cost of goods sold and occupancy costs 988.1 60.2% 888.4 60.0% 846.5 60.8%
Gross profit 653.3 39.8% 591.7 40.0% 546.7 39.2%
Operating and selling expenses 441.2 26.9% 379.5 25.7% 377.1 27.1%
Facility closure costs —— — — 2.2 0.1%
Segment operating profit $ 212.1 12.9% $ 212.2 14.3% $ 167.4 12.0%