Office Depot 2000 Annual Report Download - page 49
Download and view the complete annual report
Please find page 49 of the 2000 Office Depot annual report below. You can navigate through the pages in the report by either clicking on the pages listed below, or by using the keyword search tool below to find specific information within the annual report.-
 1
1 -
2
-
3
-
4
-
5
-
6
-
7
-
8
-
9
-
10
-
11
-
12
-
13
-
14
-
15
-
16
-
17
-
18
-
19
-
20
-
21
-
22
-
23
-
24
-
25
-
26
-
27
-
28
-
29
-
30
-
31
-
32
-
33
-
34
-
35
-
36
-
37
-
38
-
 39
39 -
 40
40 -
 41
41 -
 42
42 -
 43
43 -
 44
44 -
 45
45 -
 46
46 -
 47
47 -
 48
48 -
 49
49 -
 50
50 -
 51
51 -
 52
52
 |
 |

47
Office Depot, Inc. and Subsidiaries
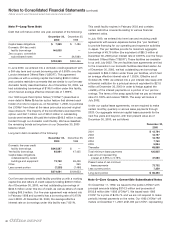
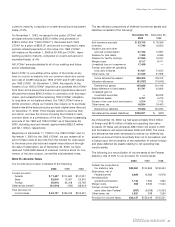
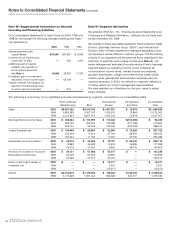
Amounts included in “Eliminations and Other” consist of
the following:
Sales consist of inter-segment sales, which are generally
recorded at the cost to the selling entity.
Earnings Before Income Taxes are primarily associated with
corporate activities and are detailed below:
2000 1999 1998
General and
administrative expenses $501,700 $381,611 $330,194
Net gain on
investment securities (12,414) ——
Interest (income) expense, net 22,399 (4,028) (2,953)
Inter-segment transactions 257 183 415
Other, net 317 ——
Total $512,259 $377,766 $327,656
Capital Expenditures, Depreciation and Amortization, and Assets
are also related primarily to our corporate activities.
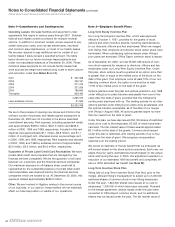
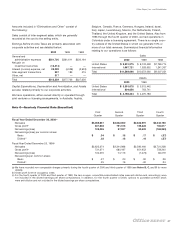
We have operations, either owned directly or operated through
joint ventures or licensing arrangements, in Australia, Austria,
Belgium, Canada, France, Germany, Hungary, Ireland, Israel,
Italy, Japan, Luxembourg, Mexico, the Netherlands, Poland,
Thailand, the United Kingdom, and the United States. Also from
1993 through the fourth quarter of 2000, we had operations in
Colombia under a licensing agreement. There is no single coun-
try outside of the United States in which we generate 10% or
more of our total revenues. Summarized financial information
relating to our operations is as follows:
Sales
2000 1999 1998
United States $ 9,901,975 $ 8,743,428 $7,765,714
International 1,667,721 1,528,632 1,241,337
Total $11,569,696 $10,272,060 $9,007,051
Assets
2000 1999
United States $ 3,391,678 $ 3,512,442
International 804,656 763,741
Total $ 4,196,334 $ 4,276,183
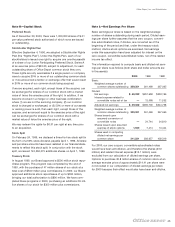
Note O—Quarterly Financial Data (Unaudited)
First Second Third Fourth
Quarter Quarter Quarter Quarter
Fiscal Year Ended December 30, 2000(a)
Net sales $3,065,657 $2,632,850 $2,822,991 $3,048,198
Gross profit(b) 837,646 751,513 735,222 765,617
Net earnings (loss) 109,036 57,937 50,622 (168,263)
Net earnings (loss) per common share:
Basic $ .34 $ .18 $ .17 $ (.57)
Diluted(c) .32 .18 .16 (.57)
Fiscal Year Ended December 25, 1999(a)
Net sales $2,625,374 $2,344,988 $2,580,460 $2,721,238
Gross profit(b) 731,371 680,187 651,952 758,240
Net earnings (loss) 100,576 74,116 (1,073) 84,019
Net earnings per common share:
Basic $ .27 $ .20 $ .00 $ .26
Diluted(c) .25 .19 .00 .24
(a) We have recorded non-comparable charges primarily during the fourth quarter of 2000 and third quarter of 1999 (see Notes B, C, and Dfor more
details).
(b) Gross profit is net of occupancy costs.
(c) For the fourth quarter of 2000 and third quarter of 1999, the zero coupon, convertible subordinated notes were anti-dilutive and, accordingly, were
not included in the diluted earnings per share computations. In addition, for the fourth quarter of 2000, options to purchase common stock
were anti-dilutive and not included in the diluted earnings per share computations.