Office Depot 2000 Annual Report Download - page 23
Download and view the complete annual report
Please find page 23 of the 2000 Office Depot annual report below. You can navigate through the pages in the report by either clicking on the pages listed below, or by using the keyword search tool below to find specific information within the annual report.-
 1
1 -
2
-
3
-
4
-
5
-
6
-
7
-
8
-
9
-
10
-
11
-
12
-
 13
13 -
 14
14 -
 15
15 -
 16
16 -
 17
17 -
 18
18 -
 19
19 -
 20
20 -
 21
21 -
 22
22 -
 23
23 -
 24
24 -
 25
25 -
 26
26 -
 27
27 -
 28
28 -
 29
29 -
 30
30 -
 31
31 -
 32
32 -
 33
33 -
34
-
35
-
36
-
37
-
38
-
39
-
40
-
41
-
42
-
43
-
44
-
45
-
46
-
47
-
48
-
49
-
50
-
51
-
52
 |
 |

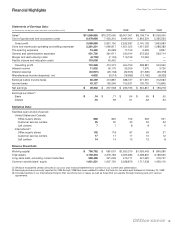
21
Office Depot, Inc. and Subsidiaries
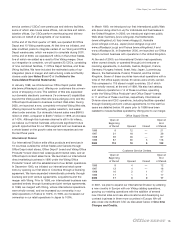
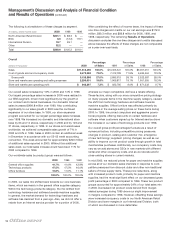
Sales in our International Division grew by 11% in 2000 and by
26% in 1999 as we continued to penetrate new and existing
markets with our Office DepotTand Viking Office ProductsT
brands. However in both 2000 and 1999, sales in our Interna-
tional Division, which are translated into and reported in U.S.
dollars, were negatively impacted by unfavorable exchange rate
changes. In local currencies, sales in our International Division
grew 23% in 2000 and 30% in 1999. The larger increase in 1999
results primarily from including the sales from our French and
Japanese operations, which were consolidated from the fourth
quarter of 1998 and the second quarter of 1999, respectively,
following our purchase of the remaining 50% interest in each of
these operations from our joint venture partners. These Office
Depot retail operations continued to show strong local currency
sales growth in 2000, with comparable store sales above 30%.
Although the Office DepotTbrand continues to grow as a
percentage of the total sales in this segment, our Viking Office
ProductsTbrand still accounts for the vast majority of our
international business representing approximately 88% of all
international sales in 2000. These Viking catalog operations had
local currency comparable sales increases of 16% in 2000 and
17% in 1999. Competitive, political and economic conditions in
international markets in which we operate may impact our sales
in the future.
As discussed above, the growth rates of our Office DepotT
brand sales exceeded those of our Viking Office ProductsT
brand in both 2000 and 1999, which contributed to the decline
in gross profit for both years. Gross profit percentages earned in
our stores are lower than the percentages earned in our catalog
business because of pricing and product mix differences and
higher occupancy costs in our stores. Also, in both 2000 and
1999, there has been an unfavorable shift in our sales mix towards
machine supplies, primarily ink and toner cartridges, which yield
lower gross profit margins than other office products. As with
our other segments, our International Division was impacted by
the higher costs for paper and machine supplies in 2000.
However, unlike our domestic segments, the effect of these cost
increases was lessened with increased pricing in our catalogs
during the latter half of the year.
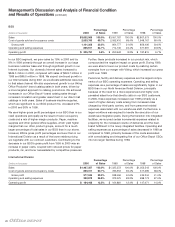
Similar to our BSG, personnel and delivery expenses are signifi-
cant components of our International Division’s operating and
selling expenses. Furthermore, because direct mail is our largest
international sales channel, advertising expense, including the
cost of catalog preparation and mailing, is a significant expense
for us. Operating and selling expenses as a percentage of
sales are higher in our International Division than in our other
segments primarily because of the use of an extensive marketing
program to drive sales in new and existing markets. Additionally,
certain of our operations are in their start-up phase, which also
increases our international operating expenses as a percentage
of sales when compared to other segments.
In 2000, strong local currency sales growth was able to better
leverage many of our fixed operating and selling expenses. Also
in 2000, our advertising expenses were significantly less than in
1999 because we were able to significantly reduce our prospect
catalog mailings in Japan, following its initial year of operation
during 1999, and we were able to implement more effective
advertising campaigns with the help of our improved data
warehouses in certain European markets. In 1999, increasing
competition in many of our established markets, coupled with
our efforts to gain market share in certain newer markets, drove
up our advertising costs. Also in 1999, the consolidation of our
French and Japanese retail operations increased operating and
selling expenses, because the majority of these locations were
in the first few years of operations and operating leverage had
not been achieved.
As our operations in a particular market grow, certain fixed
operating expenses decline relative to sales. For example,
advertising costs in the form of prospecting and delivery costs,
which are affected by the density of the delivery areas, decline
as a percentage of sales as the market grows. We expect to
leverage certain fixed operating expenses, and our cost to
attract new customers should decline as a percentage of sales
as we continue to establish our brands and grow our interna-
tional business. We believe that these improvements will be
offset by the incremental costs incurred to continue developing
new markets.
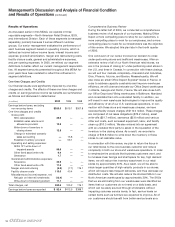
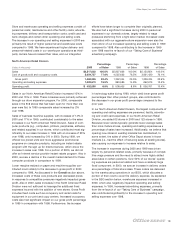
Corporate and Other
Pre-opening Expenses
(Dollars in thousands) 2000 1999 1998
Pre-opening expenses $13,465 $23,628 $17,150
Office supply stores opened* 78 159 106
*Includes domestic and wholly-owned international openings and relocations.
Our pre-opening expenses consist principally of personnel,
property and advertising expenses incurred in opening or
relocating stores in our North American Retail Division. Our
pre-opening expenses also include, to a lesser extent, expenses
incurred to open or relocate facilities in our BSG and Interna-
tional Division. We typically incur pre-opening expenses during a
six-week period prior to a store opening. Because we expense
these items as they are incurred, the amount of pre-opening
expenses each year is generally proportional to the number of
new stores opened during the period. This has been the primary
contribution to the fluctuation in pre-opening expenses over the
three years presented. For 2000, our pre-opening expenses
approximated $162,000 per domestic office supply store and
$116,000 per international office supply store. Our cost to open
a new CSC varies significantly with the size and location of the
facility. Historically, we have incurred up to $1.8 million to open
a domestic or international CSC.