Office Depot 2000 Annual Report Download - page 35
Download and view the complete annual report
Please find page 35 of the 2000 Office Depot annual report below. You can navigate through the pages in the report by either clicking on the pages listed below, or by using the keyword search tool below to find specific information within the annual report.-
 1
1 -
2
-
3
-
4
-
5
-
6
-
7
-
8
-
9
-
10
-
11
-
12
-
13
-
14
-
15
-
16
-
17
-
18
-
19
-
20
-
21
-
22
-
23
-
24
-
 25
25 -
 26
26 -
 27
27 -
 28
28 -
 29
29 -
 30
30 -
 31
31 -
 32
32 -
 33
33 -
 34
34 -
 35
35 -
 36
36 -
 37
37 -
 38
38 -
 39
39 -
 40
40 -
 41
41 -
 42
42 -
 43
43 -
 44
44 -
 45
45 -
46
-
47
-
48
-
49
-
50
-
51
-
52
 |
 |

33
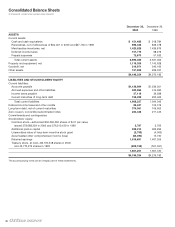
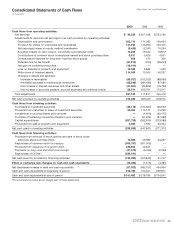
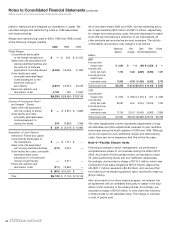
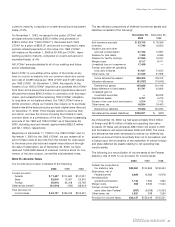
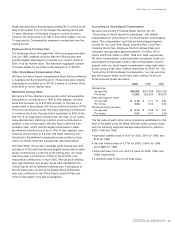
Consolidated Statements of Cash Flows
(In thousands)
Office Depot, Inc. and Subsidiaries
2000 1999 1998
Cash flows from operating activities:
Net earnings $ 49,332 $ 257,638 $ 233,196
Adjustments to reconcile net earnings to net cash provided by operating activities:
Depreciation and amortization 205,710 171,083 140,604
Provision for losses on inventories and receivables 121,226 145,996 100,375
Net (earnings) losses on equity method investments (9,436) (2,041) 15,254
Accreted interest on zero coupon, convertible subordinated notes 19,203 19,534 18,812
Contributions of common stock to employee benefit and stock purchase plans 5,817 5,426 4,501
Compensation expense for long-term incentive stock grants 652 479 336
Deferred income tax benefit (81,814) (430) (38,244)
Net gain on investment securities (12,414) ——
Loss on disposal of property and equipment 10,585 9,882 1,640
Write-down of impaired assets 114,343 13,965 46,227
Changes in assets and liabilities:
Increase in receivables (85,327) (152,523) (88,595)
(Increase) decrease in merchandise inventories (66,348) (284,489) 87,084
Net increase in prepaid expenses and other assets (21,561) (24,862) (16,792)
Net increase in accounts payable, accrued expenses and deferred credits 66,514 209,791 174,217
Total adjustments 267,150 111,811 445,419
Net cash provided by operating activities 316,482 369,449 678,615
Cash flows from investing activities:
Purchases of investment securities (30,112) (154,364) (36,697)
Proceeds from maturities or sales of investment securities 54,006 114,141 44,260
Investments in unconsolidated joint ventures —(1,606) (40,475)
Purchase of remaining ownership interest in joint ventures —(21,629) (27,680)
Capital expenditures (267,728) (392,305) (233,089)
Proceeds from sale of property and equipment 4,469 7,922 22,364
Net cash used in investing activities (239,365) (447,841) (271,317)
Cash flows from financing activities:
Proceeds from exercise of stock options and sale of stock under
employee stock purchase plans 12,388 59,082 64,237
Repurchase of common stock for treasury (300,797) (501,006) —
Proceeds from issuance of long-term debt 430,522 42,841 —
Payments on long- and short-term borrowings (27,015) (6,766) (2,490)
Repurchase of LYONsT(249,191) ——
Net cash (used in) provided by financing activities (134,093) (405,849) 61,747
Effect of exchange rate changes on cash and cash equivalents (10,326) (1,516) (4,381)
Net (decrease) increase in cash and cash equivalents (67,302) (485,757) 464,664
Cash and cash equivalents at beginning of period 218,784 704,541 239,877
Cash and cash equivalents at end of period $ 151,482 $ 218,784 $ 704,541
The accompanying notes are an integral part of these statements.