Office Depot 2000 Annual Report Download - page 25
Download and view the complete annual report
Please find page 25 of the 2000 Office Depot annual report below. You can navigate through the pages in the report by either clicking on the pages listed below, or by using the keyword search tool below to find specific information within the annual report.-
 1
1 -
2
-
3
-
4
-
5
-
6
-
7
-
8
-
9
-
10
-
11
-
12
-
13
-
14
-
 15
15 -
 16
16 -
 17
17 -
 18
18 -
 19
19 -
 20
20 -
 21
21 -
 22
22 -
 23
23 -
 24
24 -
 25
25 -
 26
26 -
 27
27 -
 28
28 -
 29
29 -
 30
30 -
 31
31 -
 32
32 -
 33
33 -
 34
34 -
 35
35 -
36
-
37
-
38
-
39
-
40
-
41
-
42
-
43
-
44
-
45
-
46
-
47
-
48
-
49
-
50
-
51
-
52
 |
 |

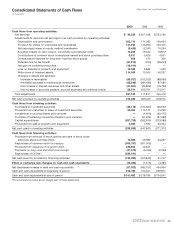
23
Office Depot, Inc. and Subsidiaries
us to finance a portion of our inventory. We generally offer credit
terms, under which we carry our own receivables, to our con-
tract and certain of our direct mail customers. As we expand
our contract and direct mail businesses, we anticipate that our
accounts receivable portfolio will continue to grow. Amounts
due for rebate, cooperative advertising and marketing programs
with our vendors comprise a significant percentage of our total
receivables. These receivables tend to fluctuate seasonally
(growing during the second half of the year and declining during
the first half), because certain collections do not happen until
after an entire program year has been completed.
The decline in operating cash flows in 2000 is primarily attrib-
utable to lower gross profit and higher store and warehouse
operating and selling expenses and general and administrative
expenses, which is more fully explained in Results of Opera-
tions. In 1999, the decrease in operating cash flows from 1998
was due mainly to our aggressive store opening program. On
a worldwide basis in 1999, excluding joint venture operations
and licensing arrangements, we opened 159 stores, including
relocations of older stores, as compared to 106 openings
during 1998. Opening a new domestic store requires that we
outlay approximately $0.5 million in cash for the portion of
our inventories that is not financed by our vendors, as well as
approximately $0.2 million for pre-opening expenses (see
Pre-opening Expenses). Our focus on supply chain manage-
ment helped boost our 1998 operating cash flows by reducing
inventories by $139 million. This focus continued to reduce the
average inventory balances held in stores and CSCs in 1999
and 2000; however, this benefit was offset by increases resulting
from stocking our new stores with inventories. Incremental Y2K-
related purchases further impacted our inventory levels in 1999.
Our primary investing activity is the acquisition of capital assets.
The number of stores and CSCs we open or remodel each year
generally drives the volume of our capital investments. Over the
past three years, we opened 78, 159 and 106 stores during
2000, 1999 and 1998, respectively. This accounts for the majority
of the variation in our investing activities over the years. During
2000, we also had significant expenditures related to our Viking
integration plans. In 1999, computer and other equipment pur-
chases at our corporate offices and at our facilities, necessary
to complete Y2K remediation, relocation of our corporate data
center, and support for our store expansion, also contributed to
our increased cash investing needs.
We currently plan to open approximately 50 stores in our North
American Retail Division and numerous stores in our International
Division during 2001. We also plan to relocate several existing
warehouses, and open two additional warehouses in our
International Division. We estimate that our cash investing
requirements will be approximately $1.1 million for each new
domestic office supply store. The $1.1 million includes approxi-
mately $0.6 million for leasehold improvements, fixtures, point-
of-sale terminals and other equipment, and approximately $0.5
million for the portion of our inventories that will not be financed
by our vendors. In addition, our average new office supply store
requires pre-opening expenses of approximately $0.2 million.
The investment required for a new CSC is significantly more
than the amounts required for a new store. Each new domestic
and international CSC requires between $6 to $16 million for
capital assets and inventory, and pre-opening expenses of up
to $1.8 million, depending on the size, type and location of the
facility. Also in 2001, we plan on spending approximately $40
million in capital investments related to re-merchandising and
remodeling our store locations and consolidating and upgrading
our call centers.
We have expanded our presence in the electronic commerce
marketplace by entering into strategic business relationships
with several Web-based providers of business-to-business
electronic commerce solutions. We made equity investments in
these companies during 2000 and 1999 of $30.1 and $50.7 million,
respectively. During 2000, we sold certain of these investments
for $57.9 million. Also, because of the recent decline in the mar-
ket for Internet related companies, we performed an extensive
valuation of each of our remaining investments at the end of
2000. This resulted in a write down of $45.5 million, reducing
the current book value of the investments at December 30, 2000
to $29.9 million. We continue to believe the Internet represents
an exciting opportunity for our products and services, and we
will continue to look for opportunities to invest in companies
that provide business-to-business e-commerce solutions for
small- and medium-sized businesses.
Financing Activities
Our domestic credit facilities provide us with a maximum of
$600.0 million in funds. These facilities consist of two separate
credit agreements, a five-year loan providing us with a working
capital line and letters of credit capacity totaling $300.0 million,
and a 364-day loan for working capital also totaling $300.0 mil-
lion. As of December 30, 2000, we had outstanding borrowings
of $389.6 million under these lines of credit, as well as letters of
credit totaling $49.5 million. Our five-year agreement was entered
into in February 1998 and has various borrowing rate options,
including a rate based on our credit rating that currently would
result in an interest rate of 0.475% over the London Interbank
Offered Rate (“LIBOR”). In June 2000, we entered into a second
credit agreement with a 364-day term, which also has various
borrowing rate options, including a current borrowing rate of
0.500% over LIBOR. At December 30, 2000, the average
effective interest rates were 7.001% and 7.996% for the five-
year and 364-day facilities, respectively. Both agreements
contain similar restrictive covenants relating to various financial
statement ratios.