Office Depot 2000 Annual Report Download - page 21
Download and view the complete annual report
Please find page 21 of the 2000 Office Depot annual report below. You can navigate through the pages in the report by either clicking on the pages listed below, or by using the keyword search tool below to find specific information within the annual report.-
 1
1 -
2
-
3
-
4
-
5
-
6
-
7
-
8
-
9
-
10
-
 11
11 -
 12
12 -
 13
13 -
 14
14 -
 15
15 -
 16
16 -
 17
17 -
 18
18 -
 19
19 -
 20
20 -
 21
21 -
 22
22 -
 23
23 -
 24
24 -
 25
25 -
 26
26 -
 27
27 -
 28
28 -
 29
29 -
 30
30 -
 31
31 -
32
-
33
-
34
-
35
-
36
-
37
-
38
-
39
-
40
-
41
-
42
-
43
-
44
-
45
-
46
-
47
-
48
-
49
-
50
-
51
-
52
 |
 |

19
Office Depot, Inc. and Subsidiaries
Sales in our North American Retail Division increased 10% in
2000 and 15% in 1999. These increases were primarily achieved
through our store expansion program. For 2000, comparable
sales in the 818 stores that had been open for more than one
year were flat. In 1999 comparable sales increased by 2%
over 1998.
Sales of business machine supplies, with increases of 14% in
2000 and 17% in 1999, contributed considerably to the sales
increases in our North American Retail Division. Sales of com-
puter products (e.g., computers, printers, peripherals, software,
and related supplies) in our stores, which contributed most sig-
nificantly to our sales increase in 1999 with an increase of 23%
over 1998, only increased by 3% in 2000. During 1999, we
offered low priced units and more aggressive promotional
programs on computer products, including an instant rebate
program with the sign up for Internet service, which drove the
increase in sales over 1998. For a portion of 2000, we did not
offer an Internet service provider instant rebate program. Also in
2000, we saw a decline in the overall market demand for these
computer products in comparison to 1999.
Lower margins realized on paper and machine supplies con-
tributed most notably to the decrease in gross profit in 2000
compared to 1999. As discussed in the Overall section above,
increased costs of these core products and decreased prices
in response to competitive pressures negatively impacted gross
profit. Also in 2000, sales increases in the North American Retail
Division were not sufficient to leverage the additional fixed
expenses incurred with the addition of new stores. Gross Profit
includes fixed costs such as occupancy and rental costs for
equipment in our print and copy centers. Increased occupancy
costs also had significant impact on our gross profit percentage
in 1999 in comparison with 1998. Furthermore, the increase
in technology sales during 1999, which yield lower gross profit
percentages than other product groups, also contributed to
the decrease in our gross profit percentage compared to the
prior year.
In our North American Retail Division, the largest components of
operating and selling expenses are personnel, facility, advertis-
ing and credit card expenses. In our North American Retail
Division, we added 63 stores in 2000 and 123 stores in 1999.
Because newer stores typically generate lower average sales
than more mature stores, operating and selling expenses as a
percentage of sales have increased. Additionally, we believe that
opening new stores in existing markets has cannibalized, to
some extent, the sales of other Office Depot stores in those
markets (i.e., had the effect of reducing sales at existing stores),
also causing our expenses to increase relative to sales.
The increase in expenses during 2000 and 1999 was driven
largely by personnel-related costs, primarily because of compet-
itive wage pressure and the need to attract more highly skilled
associates in certain positions. Over 50% of our stores’ operat-
ing expenses are personnel related and have a relatively large
fixed component. In 2000, we saw an increase in delivery orders
as a percentage of total store sales. These orders are delivered
by the warehousing operations in our BSG, which allocates a
portion of their cost to cover the delivery expense. As explained
in the BSG section below, warehouse expenses increased in
2000, which also negatively impacted operating and selling
expenses. In 1999, increased advertising expenses, primarily
from the re-launch of our “Taking Care of Business” campaign,
also contributed significantly to the increase in operating and
selling expenses over 1998.
Store and warehouse operating and selling expenses consist of
personnel costs; maintenance and other facility costs; advertis-
ing expenses; delivery and transportation costs; credit card and
bank charges and certain other operating and selling costs.
The increase in our operating and selling expenses in 2000 are
primarily the result of higher personnel and warehouse costs
compared to 1999. We have experienced higher delivery- and
personnel-related costs in our warehouse operations as third-
party carriers have increased their rates, and our integration
efforts have taken longer to complete than originally planned.
We also had a significant increase during 2000 in personnel
expenses in our domestic stores, largely related to wage
pressures stemming from a tight labor market. Increased costs
associated with our aggressive store expansion were also the
main driver of our increased operating and selling costs in 1999
compared to 1998. Also contributing to the increase in 1999
over 1998 was the re-launch of our “Taking Care of Business”
advertising campaign.
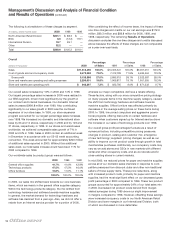
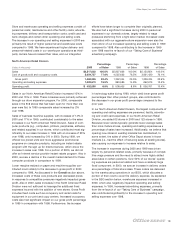
North American Retail Division
Percentage Percentage Percentage
(Dollars in thousands) 2000 of Sales 1999 of Sales 1998 of Sales
Sales $6,517,022 100.0% $5,927,666 100.0% $5,150,854 100.0%
Cost of goods sold and occupancy costs 5,054,757 77.6% 4,535,622 76.5% 3,921,420 76.1%
Gross profit 1,462,265 22.4% 1,392,044 23.5% 1,229,434 23.9%
Operating and selling expenses 1,009,670 15.5% 883,589 14.9% 692,673 13.5%
Operating profit $ 452,595 6.9% $ 508,455 8.6% $ 536,761 10.4%