Office Depot 2000 Annual Report Download - page 20
Download and view the complete annual report
Please find page 20 of the 2000 Office Depot annual report below. You can navigate through the pages in the report by either clicking on the pages listed below, or by using the keyword search tool below to find specific information within the annual report.-
 1
1 -
2
-
3
-
4
-
5
-
6
-
7
-
8
-
9
-
 10
10 -
 11
11 -
 12
12 -
 13
13 -
 14
14 -
 15
15 -
 16
16 -
 17
17 -
 18
18 -
 19
19 -
 20
20 -
 21
21 -
 22
22 -
 23
23 -
 24
24 -
 25
25 -
 26
26 -
 27
27 -
 28
28 -
 29
29 -
 30
30 -
31
-
32
-
33
-
34
-
35
-
36
-
37
-
38
-
39
-
40
-
41
-
42
-
43
-
44
-
45
-
46
-
47
-
48
-
49
-
50
-
51
-
52
 |
 |

18
Management’s Discussion and Analysis of Financial Condition
and Results of Operations (continued)
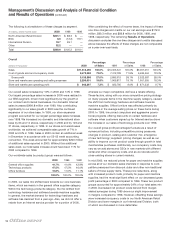
Our overall sales increased by 13% in 2000 and 14% in 1999.
Our largest percentage sales increases in 2000 were realized in
our BSG segment, driven most significantly by the growth in
our contract and Internet businesses. Our domestic Internet
sales increased $499.8 million over 1999. Also contributing
significantly to our sales growth in 2000 was the continued
expansion of our store base. In 1999, our store expansion
program accounted for our largest percentage sales increases
over 1998. We increased our domestic and international store
base by 63 and 14 stores, respectively, in 2000 and by 123 and
31 stores, respectively, in 1999. In our stores and warehouses
worldwide, we achieved comparable sales growth of 7% in
2000 and 6% in 1999. Sales in 2000 contain an additional week
in December in accordance with our 52–53 week accounting
convention. This week accounted for approximately $224 million
of additional sales reported in 2000. Without this additional
sales week, our total sales increase would have been 11% for
2000 compared to 1999.
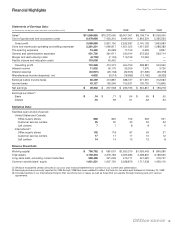
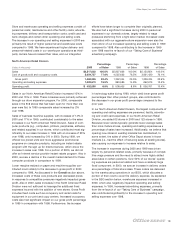
Our worldwide sales by product group were as follows:
2000 1999 1998
General office supplies 41.7% 41.0% 42.9%
Technology products 47.5% 47.5% 46.0%
Office furniture 10.8% 11.5% 11.1%
100.0% 100.0% 100.0%
In 2000, our sales mix shifted back towards our core business
items, which are mainly in the general office supplies category.
Within the technology products category, the mix shifted from
technology hardware and software towards machine supplies.
In general, the market demand for technology hardware and
software has declined from a year ago. Also, we did not offer a
rebate from an Internet service provider for a portion of 2000,
whereas our major competitors did have a rebate offering.
These factors, along with our more competitive pricing strategy
on many popular items in the machine supply category, caused
the shift from technology hardware and software towards
machine supplies. Office furniture was affected primarily by
decreases in the average selling prices on these items during
2000. In 1999, low priced computers and aggressive promo-
tional programs offering discounts on certain hardware and
software when customers signed up for Internet service drove
the increase in our sales of technology products over 1998.
Our overall gross profit percentages fluctuate as a result of
numerous factors, including competitive pricing pressures;
changes in product, catalog and customer mix; emergence
of new technology; suppliers’ pricing changes; as well as our
ability to improve our net product costs through growth in total
merchandise purchases. Additionally, our occupancy costs may
vary as we add stores and CSCs in new markets with different
rental and other occupancy costs, and as we relocate and/or
close existing stores in current markets.
In mid-2000, we reduced prices for paper and machine supplies
across all of our domestic sales channels in response to com-
petitive pressures from discount clubs and other non-traditional
sellers of those supply items. These price reductions, along
with increased product costs, primarily for paper and machine
supplies, had the most significant effect on our decreased gross
profit percentage in 2000 compared to 1999. These two product
groups accounted for approximately 34% of our total sales mix
in 2000. Decreased net product costs derived from merger-
related synergies during 1999 drove our slight improvement
in margins compared to 1998. However, offsetting these savings
were increased occupancy costs in our North American Retail
Division and lower margins in our International Division, both
of which are discussed in more detail later.
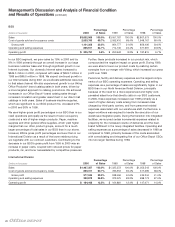
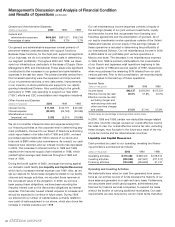
Overall
Percentage Percentage Percentage
(Dollars in thousands) 2000 of Sales 1999 of Sales 1998 of Sales
Sales $11,612,496 100.0% $10,306,341 100.0% $9,007,051 100.0%
Cost of goods sold and occupancy costs 8,473,598 73.0% 7,412,729 71.9% 6,484,464 72.0%
Gross profit 3,138,898 27.0% 2,893,612 28.1% 2,522,587 28.0%
Store and warehouse operating and selling expenses 2,296,601 19.8% 1,969,817 19.1% 1,651,355 18.3%
Store and warehouse operating profit $ 842,297 7.2% $ 923,795 9.0% $ 871,232 9.7%
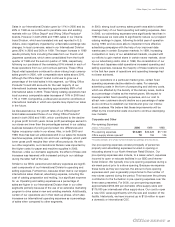
The following is a breakdown of these charges by segment.
(In millions, before income taxes) 2000 1999 1998
North American Retail Division $201.1 $ 88.3 $ —
BSG 8.6 (12.2) 119.1
International Division 18.7 29.1 —
Other 32.2 ——
Total $260.6 $105.2 $119.1
After considering the effect of income taxes, the impact of these
one-time charges and credits on our net earnings was $172.9
million, $69.3 million and $86.8 million for 2000, 1999, and
1998, respectively. The remaining Results of Operations
discussion excludes the one-time charges and credits discussed
above because the effects of these charges are not comparable
on a year-over-year basis.