Navy Federal Credit Union 2013 Annual Report Download - page 68
Download and view the complete annual report
Please find page 68 of the 2013 Navy Federal Credit Union annual report below. You can navigate through the pages in the report by either clicking on the pages listed below, or by using the keyword search tool below to find specific information within the annual report.-
 1
1 -
2
-
3
-
4
-
5
-
6
-
7
-
8
-
9
-
10
-
11
-
12
-
13
-
14
-
15
-
16
-
17
-
18
-
19
-
20
-
21
-
22
-
23
-
24
-
25
-
26
-
27
-
28
-
29
-
30
-
31
-
32
-
33
-
34
-
35
-
36
-
37
-
38
-
39
-
40
-
41
-
42
-
43
-
44
-
45
-
46
-
47
-
48
-
49
-
50
-
51
-
52
-
53
-
54
-
55
-
56
-
57
-
 58
58 -
 59
59 -
 60
60 -
 61
61 -
 62
62 -
 63
63 -
 64
64 -
 65
65 -
 66
66 -
 67
67 -
 68
68 -
 69
69 -
 70
70 -
 71
71 -
 72
72 -
 73
73
 |
 |

Navy Federal Credit Union • 2013 Financial Section
48
2013 ANNUAL REPORT
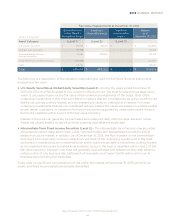
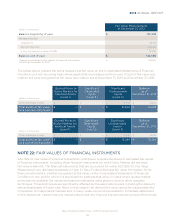
fluctuations on a period-by-period basis. Fair value less costs to sell is an estimated value based on
relevant recent historical data that are considered unobservable inputs, and as such, REO is classified
as Level 3 in the fair value hierarchy and valued on a non-recurring basis.
During the holding period, BPOs are updated to reflect changes in fair value, and the REO is carried at
the lower of the amount recorded at acquisition date or estimated fair value less costs to sell. Holding
costs such as insurance, maintenance, taxes, and utility costs are expensed as incurred. Navy Federal
markets the REO properties for sale to the public and generally does not hold properties for longer than
one year. Valuation adjustments on these assets as well as gains or losses realized from disposition of
such properties are reflected in Other non-interest expense on the Consolidated Statements of Income.
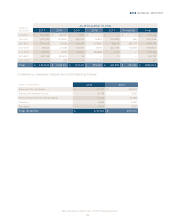
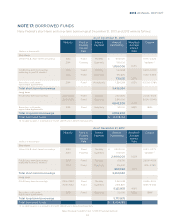
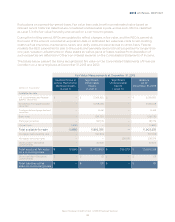
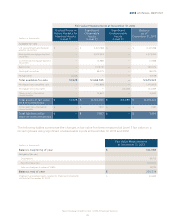
The tables below present the items recognized at fair value on the Consolidated Statements of Financial
Condition on a recurring basis at December 31, 2013 and 2012:
(dollars in thousands)
Active Markets for
Identical Assets
Observable
Unobservable
as of
Available-for-sale
U.S. government and federal
agency securities $ — $ 5,069,920 $ — $ 5,069,920
Residential mortgage-backed
securities — 5,058,468 — 5,058,468
Commercial mortgage-backed
securities — 14,461 — 14,461
Bank notes — 1,561,730 — 1,561,730
Municipal securities — 187,776 — 187,776
Mutual funds 10,880 — — 10,880
Total available-for-sale —
Mortgage loans awaiting sale — 507,948 — 507,948
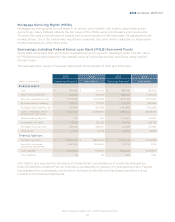
Mortgage servicing rights — — 236,579 236,579
Other assets—Derivative
commitments — 32,506 — 32,506
$ $ $ $
Other liabilities—Derivative
commitments $ — $ 131 $ — $ 131
Total liabilities at fair
$ — $ $ — $