Navy Federal Credit Union 2013 Annual Report Download - page 57
Download and view the complete annual report
Please find page 57 of the 2013 Navy Federal Credit Union annual report below. You can navigate through the pages in the report by either clicking on the pages listed below, or by using the keyword search tool below to find specific information within the annual report.-
 1
1 -
2
-
3
-
4
-
5
-
6
-
7
-
8
-
9
-
10
-
11
-
12
-
13
-
14
-
15
-
16
-
17
-
18
-
19
-
20
-
21
-
22
-
23
-
24
-
25
-
26
-
27
-
28
-
29
-
30
-
31
-
32
-
33
-
34
-
35
-
36
-
37
-
38
-
39
-
40
-
41
-
42
-
43
-
44
-
45
-
46
-
 47
47 -
 48
48 -
 49
49 -
 50
50 -
 51
51 -
 52
52 -
 53
53 -
 54
54 -
 55
55 -
 56
56 -
 57
57 -
 58
58 -
 59
59 -
 60
60 -
 61
61 -
 62
62 -
 63
63 -
 64
64 -
 65
65 -
 66
66 -
 67
67 -
68
-
69
-
70
-
71
-
72
-
73
 |
 |

Navy Federal Credit Union • 2013 Financial Section
37
2013 ANNUAL REPORT
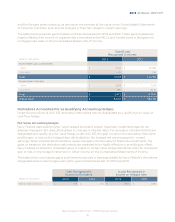
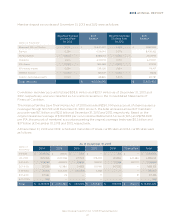
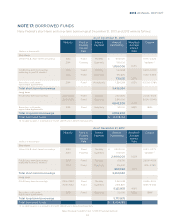
Member deposit accounts as of December 31, 2013 and 2012 were as follows:
(dollars in thousands)
Weighted-Average
Dividend Rate
for 2013
2013
Balance
Weighted-Average
Dividend Rate
for 2012
2012
Balance
Share and IRA certificates 2.10% $ 13,940,020 2.36% $ 13,887,953
Savings 0.25% 9,514,144 0.27% 8,436,922
Money market 0.54% 8,588,012 0.61% 7,672,947
Checking 0.16% 6,914,178 0.21% 6,217,947
IRA shares 0.25% 584,289 0.27% 517,224
IRA money market 0.53% 235,038 0.61% 176,471
Member escrow 0.07% 159,527 0.16% 143,181
Investor custodial accounts 0.00% 88,833 0.00% 312,787
Total deposits $ $
Overdrawn member accounts totaled $33.6 million and $23.7 million as of December 31, 2013 and
2012, respectively, and are classified as Accounts receivable in the Consolidated Statements of
Financial Condition.
The Helping Families Save Their Homes Act of 2009 provided $250,000 per account of share insurance
coverage through NCUSIF until December 31, 2013. As such, the total uninsured amount of members’
accounts was $3.1 billion and $2.8 billion at December 31, 2013 and 2012, respectively. Based on the
original insurance coverage of $100,000 per non-Individual Retirement Account (IRA) and $250,000
per IRA, the amount of members’ accounts exceeding the original coverage limits was $8.5 billion and
$7.7 billion at December 31, 2013 and 2012, respectively.
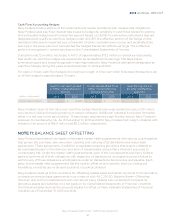
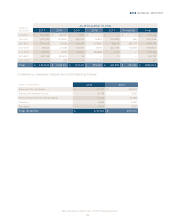
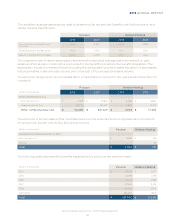
At December 31, 2013 and 2012, scheduled maturities of share certificates and IRA certificates were
as follows:
(dollars in
thousands)
Thereafter Total
0–1.00% $ 4,109,592 $ 396,111 $ 2,971 $ — $ 745 $ — $ 4,509,419
1.01–2.00 1,565,398 1,240,008 620,570 479,409 439,854 344,384 4,689,623
2.01–3.00 248,783 338,523 398,811 185,914 70,088 497,774 1,739,893
3.01–4.00 511,536 127,589 14,803 631,785 607,392 — 1,893,105
4.01–5.00 14,645 304,506 464,668 6,558 — — 790,377
5.01–6.00 317,282 23 — 11 — 19 317,335
6.01–7.00% 268 — — — — — 268
Total $ 6,767,504 $ 2,406,760 $ 1,501,823 $ 1,303,677 $ 1,118,079 $ 842,177 $ 13,940,020