Mitsubishi 2008 Annual Report Download - page 3
Download and view the complete annual report
Please find page 3 of the 2008 Mitsubishi annual report below. You can navigate through the pages in the report by either clicking on the pages listed below, or by using the keyword search tool below to find specific information within the annual report.-
 1
1 -
 2
2 -
 3
3 -
 4
4 -
 5
5 -
 6
6 -
 7
7 -
 8
8 -
 9
9 -
 10
10 -
 11
11 -
 12
12 -
 13
13 -
 14
14 -
15
-
16
-
17
-
18
-
19
-
20
-
21
-
22
-
23
-
24
-
25
-
26
-
27
-
28
-
29
-
30
-
31
-
32
-
33
-
34
-
35
-
36
-
37
-
38
-
39
-
40
-
41
-
42
-
43
-
44
-
45
-
46
-
47
-
48
-
49
-
50
-
51
-
52
-
53
-
54
-
55
-
56
-
57
-
58
-
59
-
60
-
61
-
62
-
63
-
64
-
65
-
66
-
67
-
68
-
69
-
70
-
71
-
72
-
73
-
74
-
75
-
76
-
77
-
78
-
79
-
80
-
81
-
82
-
83
-
84
-
85
-
86
-
87
-
88
 |
 |

01
annual report 2008 mitsubishi motors corporation
07
06
05
04
03
2,682.1
2,202.9
2,120.1
2,122.6
2,519.4
07
06
05
04
03
1,609.4
1,778.7
1,557.6
1,589.3
2,029.0
07
06
05
04
03
108.6
40.2
6.8
-128.5
-96.9
07
06
05
04
03
34.7
8.7
-92.2
-474.8
-215.4
In millions of yen
In thousands of
U.S. dollars
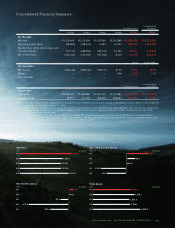
FY2003 FY2004 FY2005 FY2006 FY2007 FY2007
For the year:
Net sales ¥2,519,449 ¥2,122,626 ¥2,120,068 ¥2,202,869 ¥2,682,103 $26,770,169
Operating income (loss) (96,852) (128,544) 6,783 40,237 108,596 1,083,904
Income (loss) before income taxes and
minority interest (77,173) (460,906) (82,745) 23,104 48,151 480,599
Net income (loss) (215,424) (474,785) (92,166) 8,745 34,710 346,447
In yen In U.S. dollars
Per share data:
Net income ¥(145.22) ¥(194.36) ¥(19.75) ¥1.59 ¥6.30 $0.06
Diluted — — — 0.96 3.81 0.04
Cash dividends — — — — ——
In millions of yen
In thousands of
U.S. dollars
At year-end:
Total assets ¥2,029,035 ¥1,589,286 ¥1,557,570 ¥1,778,693 ¥1,609,408 $16,063,562
Total net assets 29,972 324,782 268,678 308,304 328,132 3,275,104
Notes: 1. U.S. dollar amounts in the accompanying consolidated financial statements are converted, solely for convenience, at a rate of ¥100.19 = U.S. $1.00, the
exchange rate prevailing on March 31, 2008.
2. The assets and liabilities of truck and bus operations are not reflected in each account because these operations were spun off and subsequently
became an equity-method affiliate of MMC on March 14, 2003. Furthermore, all remaining shares held by MMC had been transferred to other
parties by the end of March 2005.
3. In calculating net assets, MMC and subsidiaries have applied the “Accounting Standard for Presentation of Net Assets in the Balance Sheet”
(Accounting Standard Boards of Japan (ASBJ) Statement No. 5) and the “Guidance on Accounting Standard for Presentation of Net Assets in the
Balance Sheet” (ASBJ Guidance No. 8) since the year ended March 31, 2007.
Net Sales
Net Income (Loss)
Operating Income (Loss)
(¥ billion)
(¥ billion)
(¥ billion)
(¥ billion)
(FY) (FY)
(FY)(FY)
Total Assets
Consolidated Financial Summary
01
annual report 2008 mitsubishi motors corporation