Medco 2015 Annual Report Download - page 84
Download and view the complete annual report
Please find page 84 of the 2015 Medco annual report below. You can navigate through the pages in the report by either clicking on the pages listed below, or by using the keyword search tool below to find specific information within the annual report.-
 1
1 -
2
-
3
-
4
-
5
-
6
-
7
-
8
-
9
-
10
-
11
-
12
-
13
-
14
-
15
-
16
-
17
-
18
-
19
-
20
-
21
-
22
-
23
-
24
-
25
-
26
-
27
-
28
-
29
-
30
-
31
-
32
-
33
-
34
-
35
-
36
-
37
-
38
-
39
-
40
-
41
-
42
-
43
-
44
-
45
-
46
-
47
-
48
-
49
-
50
-
51
-
52
-
53
-
54
-
55
-
56
-
57
-
58
-
59
-
60
-
61
-
62
-
63
-
64
-
65
-
66
-
67
-
68
-
69
-
70
-
71
-
72
-
73
-
 74
74 -
 75
75 -
 76
76 -
 77
77 -
 78
78 -
 79
79 -
 80
80 -
 81
81 -
 82
82 -
 83
83 -
 84
84 -
 85
85 -
 86
86 -
 87
87 -
 88
88 -
 89
89 -
 90
90 -
 91
91 -
 92
92 -
 93
93 -
 94
94 -
95
-
96
-
97
-
98
-
99
-
100
 |
 |

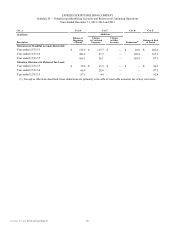
82
Express Scripts 2015 Annual Report
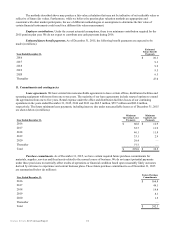
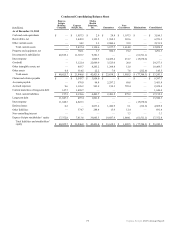
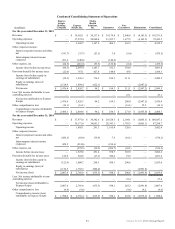
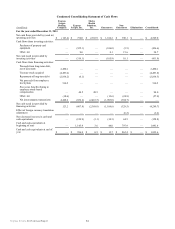
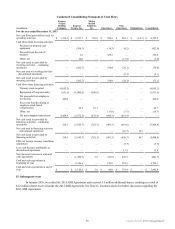
Condensed Consolidating Statement of Operations
(in millions)
Express
Scripts
Holding
Company
Express
Scripts, Inc.
Medco
Health
Solutions,
Inc. Guarantors
Non-
Guarantors Eliminations Consolidated
For the year ended December 31, 2013
Revenues $ — $ 30,015.9 $ 52,736.8 $ 23,160.0 $ 1,919.0 $ (3,732.9) $ 104,098.8
Operating expenses — 28,475.3 52,498.3 21,867.4 1,439.0 (3,732.9) 100,547.1
Operating income — 1,540.6 238.5 1,292.6 480.0 — 3,551.7
Other (expense) income, net (343.9) (148.8) (23.5) 5.4 (10.6) — (521.4)
Income (loss) before income taxes (343.9) 1,391.8 215.0 1,298.0 469.4 — 3,030.3
Provision (benefit) for income taxes (124.8) 530.4 93.3 473.2 131.9 — 1,104.0
Income (loss) from continuing
operations before equity in earnings
of subsidiaries (219.1) 861.4 121.7 824.8 337.5 — 1,926.3
Net loss from discontinued
operations, net of tax — — — — (53.6) — (53.6)
Equity in earnings of subsidiaries 2,063.7 807.7 272.9 — — (3,144.3) —
Net income $ 1,844.6 $ 1,669.1 $ 394.6 $ 824.8 $ 283.9 $ (3,144.3) $ 1,872.7
Less: Net income attributable to non-
controlling interest ————28.1 — 28.1
Net income attributable to Express
Scripts 1,844.6 1,669.1 394.6 824.8 255.8 (3,144.3) 1,844.6
Other comprehensive loss (7.2) (7.2) — — (7.2) 14.4 (7.2)
Comprehensive income attributable
to Express Scripts $ 1,837.4 $ 1,661.9 $ 394.6 $ 824.8 $ 248.6 $ (3,129.9) $ 1,837.4