Medco 2015 Annual Report Download - page 77
Download and view the complete annual report
Please find page 77 of the 2015 Medco annual report below. You can navigate through the pages in the report by either clicking on the pages listed below, or by using the keyword search tool below to find specific information within the annual report.-
 1
1 -
2
-
3
-
4
-
5
-
6
-
7
-
8
-
9
-
10
-
11
-
12
-
13
-
14
-
15
-
16
-
17
-
18
-
19
-
20
-
21
-
22
-
23
-
24
-
25
-
26
-
27
-
28
-
29
-
30
-
31
-
32
-
33
-
34
-
35
-
36
-
37
-
38
-
39
-
40
-
41
-
42
-
43
-
44
-
45
-
46
-
47
-
48
-
49
-
50
-
51
-
52
-
53
-
54
-
55
-
56
-
57
-
58
-
59
-
60
-
61
-
62
-
63
-
64
-
65
-
66
-
 67
67 -
 68
68 -
 69
69 -
 70
70 -
 71
71 -
 72
72 -
 73
73 -
 74
74 -
 75
75 -
 76
76 -
 77
77 -
 78
78 -
 79
79 -
 80
80 -
 81
81 -
 82
82 -
 83
83 -
 84
84 -
 85
85 -
 86
86 -
 87
87 -
88
-
89
-
90
-
91
-
92
-
93
-
94
-
95
-
96
-
97
-
98
-
99
-
100
 |
 |

75 Express Scripts 2015 Annual Report
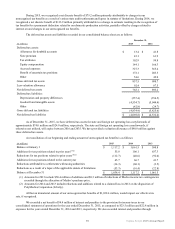
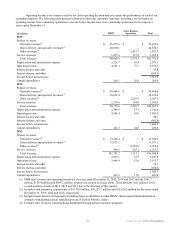
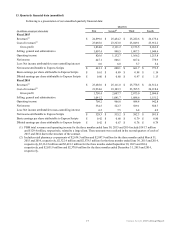
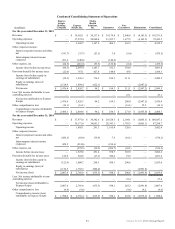
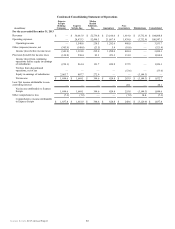
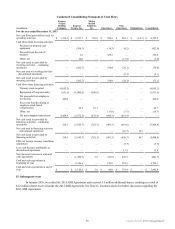
Operating income is the measure used by our chief operating decision maker to assess the performance of each of our
operating segments. The following table presents information about our reportable segments, including a reconciliation of
operating income from continuing operations to income before income taxes from continuing operations for the respective
years ended December 31.
(in millions) PBM(1) Other Business
Operations Total
2015
Product revenues:
Network revenues(2) $ 56,472.6 $ — $ 56,472.6
Home delivery and specialty revenues(3) 40,830.1 — 40,830.1
Other revenues(4) — 2,453.7 2,453.7
Service revenues 1,657.6 337.8 1,995.4
Total revenues 98,960.3 2,791.5 101,751.8
Depreciation and amortization expense 2,328.7 30.4 2,359.1
Operating income 4,262.2 77.1 4,339.3
Interest income and other 24.8
Interest expense and other (500.3)
Income before income taxes 3,863.8
Capital expenditures 269.1 26.8 295.9
2014
Product revenues:
Network revenues(2) $ 58,468.6 $ — $ 58,468.6
Home delivery and specialty revenues(3) 38,633.0 — 38,633.0
Other revenues(4) — 2,203.5 2,203.5
Service revenues 1,278.0 304.0 1,582.0
Total revenues 98,379.6 2,507.5 100,887.1
Depreciation and amortization expense 2,209.5 33.4 2,242.9
Operating income 3,546.4 56.0 3,602.4
Interest income and other 46.7
Interest expense and other (582.9)
Income before income taxes 3,066.2
Capital expenditures 412.3 24.3 436.6
2013
Product revenues:
Network revenues(2) $ 63,244.4 $ — $ 63,244.4
Home delivery and specialty revenues(3) 37,571.1 — 37,571.1
Other revenues(4) — 2,052.0 2,052.0
Service revenues 966.2 265.1 1,231.3
Total revenues 101,781.7 2,317.1 104,098.8
Depreciation and amortization expense 2,419.1 27.9 2,447.0
Operating income 3,498.9 52.8 3,551.7
Interest income and other 74.7
Interest expense and other (596.1)
Income before income taxes 3,030.3
Capital expenditures 411.2 11.8 423.0
(1) PBM total revenues and operating income for the years ended December 31, 2015, 2014 and 2013 include $141.7
million, $129.4 million and $108.2 million, respectively, related to a large client. These amounts were realized in the
second quarters of each of 2015, 2014 and 2013 due to the structure of the contract.
(2) Includes retail pharmacy co-payments of $9,170.0 million, $10,272.7 million and $12,620.3 million for the years ended
December 31, 2015, 2014 and 2013, respectively.
(3) Includes home delivery and specialty, including drugs we distribute to other PBMs’ clients under limited distribution
contracts with pharmaceutical manufacturers and Freedom Fertility claims.
(4) Includes other revenues related to drugs distributed through patient assistance programs.