Medco 2015 Annual Report Download - page 71
Download and view the complete annual report
Please find page 71 of the 2015 Medco annual report below. You can navigate through the pages in the report by either clicking on the pages listed below, or by using the keyword search tool below to find specific information within the annual report.-
 1
1 -
2
-
3
-
4
-
5
-
6
-
7
-
8
-
9
-
10
-
11
-
12
-
13
-
14
-
15
-
16
-
17
-
18
-
19
-
20
-
21
-
22
-
23
-
24
-
25
-
26
-
27
-
28
-
29
-
30
-
31
-
32
-
33
-
34
-
35
-
36
-
37
-
38
-
39
-
40
-
41
-
42
-
43
-
44
-
45
-
46
-
47
-
48
-
49
-
50
-
51
-
52
-
53
-
54
-
55
-
56
-
57
-
58
-
59
-
60
-
 61
61 -
 62
62 -
 63
63 -
 64
64 -
 65
65 -
 66
66 -
 67
67 -
 68
68 -
 69
69 -
 70
70 -
 71
71 -
 72
72 -
 73
73 -
 74
74 -
 75
75 -
 76
76 -
 77
77 -
 78
78 -
 79
79 -
 80
80 -
 81
81 -
82
-
83
-
84
-
85
-
86
-
87
-
88
-
89
-
90
-
91
-
92
-
93
-
94
-
95
-
96
-
97
-
98
-
99
-
100
 |
 |

69 Express Scripts 2015 Annual Report
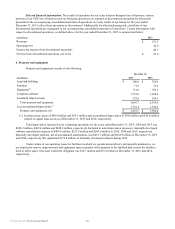
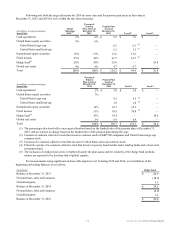
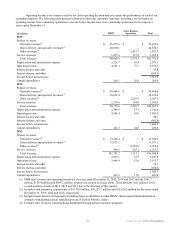
The fair value of stock options granted was estimated on the date of grant using a Black-Scholes multiple option-
pricing model with the following weighted-average assumptions:
Year Ended December 31,
2015 2014 2013
Expected life of option 3-5 years 3-5 years 4-5 years
Risk-free interest rate 1.0%-1.7% 0.7%-1.8% 0.6%-1.7%
Expected volatility of stock 19%-26% 21%-29% 27%-37%
Expected dividend yield None None None
Weighted-average volatility of stock 24.0% 27.4% 34.1%
The Black-Scholes model requires subjective assumptions, including future stock price volatility and expected time to
exercise, which greatly affect the calculated values. The expected term and forfeiture rate of stock options is derived from
historical data on employee exercises and post-vesting employment termination behavior as well as expected behavior on
outstanding stock options. The risk-free rate is based on the United States Treasury rates in effect during the corresponding
period of grant. The expected volatility is based on the historical volatility of our stock price. These factors could change in the
future, which would affect the stock-based compensation expense recognized in future periods.
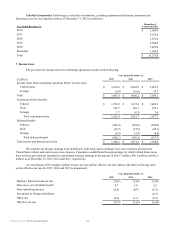
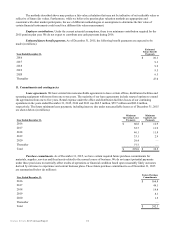
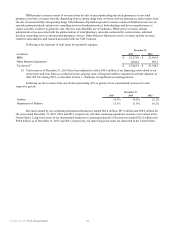
Cash proceeds and intrinsic value related to total stock options exercised and weighted-average fair value of stock
options granted during the years ended December 31, 2015, 2014 and 2013 are provided in the following table:
Year Ended December 31,
(in millions, except per share data) 2015 2014 2013
Proceeds from stock options exercised $ 213.2 $ 542.4 $ 524.0
Intrinsic value of stock options exercised 212.8 476.3 362.0
Weighted-average fair value per share of options granted during the year $ 18.03 $ 17.98 $ 17.17
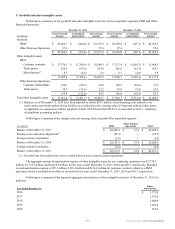
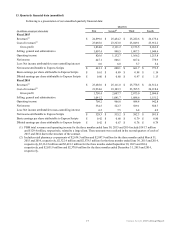
10. Pension benefits
Net pension benefit. We have elected to determine the projected benefit obligation as the value of the benefits to
which employees would be entitled if they separated from service immediately. Under this approach, the liability is equal to the
employee’s account value as of the measurement date.
Effective 2011, the defined benefit pension plan (“pension plan”) was frozen for all participants. Participants no longer
accrue any benefits under the pension plan and the pension plan has been closed to new entrants since February 2011. However,
account balances continue to be credited with interest until paid.
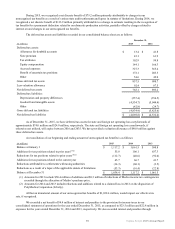
For the years ended December 31, 2015, 2014 and 2013 the net benefit for the pension plan consisted of the following
components:
Year Ended December 31,
(in millions) 2015 2014 2013
Interest cost $ 0.3 $ 0.4 $ 0.5
Actual loss (gain) on plan assets 1.5 (6.3)(15.3)
Net actuarial loss (gain) — 0.1 (0.4)
Net expense (benefit) $ 1.8 $ (5.8)$ (15.2)