Medco 2015 Annual Report Download - page 35
Download and view the complete annual report
Please find page 35 of the 2015 Medco annual report below. You can navigate through the pages in the report by either clicking on the pages listed below, or by using the keyword search tool below to find specific information within the annual report.-
 1
1 -
2
-
3
-
4
-
5
-
6
-
7
-
8
-
9
-
10
-
11
-
12
-
13
-
14
-
15
-
16
-
17
-
18
-
19
-
20
-
21
-
22
-
23
-
24
-
 25
25 -
 26
26 -
 27
27 -
 28
28 -
 29
29 -
 30
30 -
 31
31 -
 32
32 -
 33
33 -
 34
34 -
 35
35 -
 36
36 -
 37
37 -
 38
38 -
 39
39 -
 40
40 -
 41
41 -
 42
42 -
 43
43 -
 44
44 -
 45
45 -
46
-
47
-
48
-
49
-
50
-
51
-
52
-
53
-
54
-
55
-
56
-
57
-
58
-
59
-
60
-
61
-
62
-
63
-
64
-
65
-
66
-
67
-
68
-
69
-
70
-
71
-
72
-
73
-
74
-
75
-
76
-
77
-
78
-
79
-
80
-
81
-
82
-
83
-
84
-
85
-
86
-
87
-
88
-
89
-
90
-
91
-
92
-
93
-
94
-
95
-
96
-
97
-
98
-
99
-
100
 |
 |

33 Express Scripts 2015 Annual Report
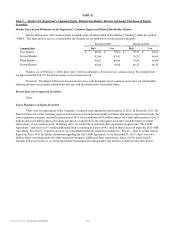
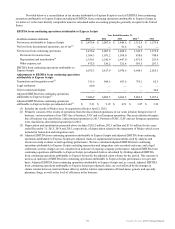
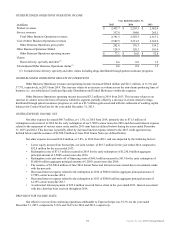
Item 6 — Selected Financial Data
The following selected financial data should be read in conjunction with our consolidated financial statements,
including the related notes, and “Part II — Item 7 — Management’s Discussion and Analysis of Financial Condition and
Results of Operations.” Results for the years ended December 31, 2013 and 2012 reflect the discontinued operations of our
acute infusion therapies line of business, various portions of our United BioSource (“UBC”) line of business, Europa Apotheek
Venlo B.V. (“EAV”) and our European operations.
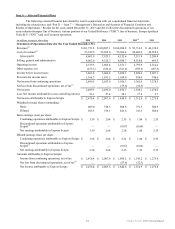
(in millions, except per share data) 2015 2014 2013 2012(1) 2011
Statement of Operations Data (for the Year Ended December 31):
Revenues(2) $ 101,751.8 $ 100,887.1 $ 104,098.8 $ 93,714.3 $ 46,128.3
Cost of revenues(2) 93,349.9 92,962.0 95,966.4 86,402.4 42,918.4
Gross profit 8,401.9 7,925.1 8,132.4 7,311.9 3,209.9
Selling, general and administrative 4,062.6 4,322.7 4,580.7 4,518.0 895.5
Operating income 4,339.3 3,602.4 3,551.7 2,793.9 2,314.4
Other expense, net (475.5)(536.2)(521.4)(593.5)(287.3)
Income before income taxes 3,863.8 3,066.2 3,030.3 2,200.4 2,027.1
Provision for income taxes 1,364.3 1,031.2 1,104.0 838.0 748.6
Net income from continuing operations 2,499.5 2,035.0 1,926.3 1,362.4 1,278.5
Net loss from discontinued operations, net of tax(3) ——
(53.6)(32.3)—
Net income 2,499.5 2,035.0 1,872.7 1,330.1 1,278.5
Less: Net income attributable to non-controlling interest 23.1 27.4 28.1 17.2 2.7
Net income attributable to Express Scripts $ 2,476.4 $ 2,007.6 $ 1,844.6 $ 1,312.9 $ 1,275.8
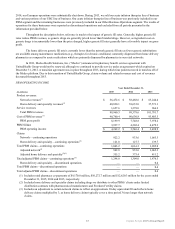
Weighted-average shares outstanding:
Basic: 689.0 750.3 808.6 731.3 500.9
Diluted: 695.3 759.1 821.6 747.3 505.0
Basic earnings (loss) per share:
Continuing operations attributable to Express Scripts $ 3.59 $ 2.68 $ 2.35 $ 1.84 $ 2.55
Discontinued operations attributable to Express
Scripts(3) ——
(0.07)(0.04)—
Net earnings attributable to Express Scripts 3.59 2.68 2.28 1.80 2.55
Diluted earnings (loss) per share:
Continuing operations attributable to Express Scripts $ 3.56 $ 2.64 $ 2.31 $ 1.80 $ 2.53
Discontinued operations attributable to Express
Scripts(3) ——
(0.07)(0.04)—
Net earnings attributable to Express Scripts 3.56 2.64 2.25 1.76 2.53
Amounts attributable to Express Scripts:
Income from continuing operations, net of tax $ 2,476.4 $ 2,007.6 $ 1,898.2 $ 1,345.2 $ 1,275.8
Net loss from discontinued operations, net of tax(3) ——
(53.6)(32.3)—
Net income attributable to Express Scripts $ 2,476.4 $ 2,007.6 $ 1,844.6 $ 1,312.9 $ 1,275.8