Medco 2015 Annual Report Download - page 61
Download and view the complete annual report
Please find page 61 of the 2015 Medco annual report below. You can navigate through the pages in the report by either clicking on the pages listed below, or by using the keyword search tool below to find specific information within the annual report.-
 1
1 -
2
-
3
-
4
-
5
-
6
-
7
-
8
-
9
-
10
-
11
-
12
-
13
-
14
-
15
-
16
-
17
-
18
-
19
-
20
-
21
-
22
-
23
-
24
-
25
-
26
-
27
-
28
-
29
-
30
-
31
-
32
-
33
-
34
-
35
-
36
-
37
-
38
-
39
-
40
-
41
-
42
-
43
-
44
-
45
-
46
-
47
-
48
-
49
-
50
-
 51
51 -
 52
52 -
 53
53 -
 54
54 -
 55
55 -
 56
56 -
 57
57 -
 58
58 -
 59
59 -
 60
60 -
 61
61 -
 62
62 -
 63
63 -
 64
64 -
 65
65 -
 66
66 -
 67
67 -
 68
68 -
 69
69 -
 70
70 -
 71
71 -
72
-
73
-
74
-
75
-
76
-
77
-
78
-
79
-
80
-
81
-
82
-
83
-
84
-
85
-
86
-
87
-
88
-
89
-
90
-
91
-
92
-
93
-
94
-
95
-
96
-
97
-
98
-
99
-
100
 |
 |
59 Express Scripts 2015 Annual Report
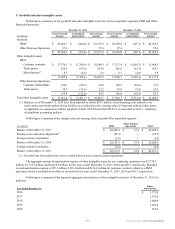
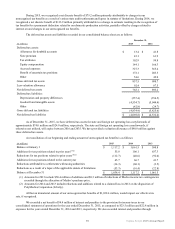
reclassified from “Other intangible assets, net” to “Other assets” on our consolidated balance sheet as of December 31, 2014.
Comparatively, net financing costs of $48.1 million related to our senior notes and term loans are reflected as a reduction in the
carrying value of our long-term debt, and net financing costs of $6.6 million related to our 2015 revolving facility are reflected
in “Other assets” on our consolidated balance sheet as of December 31, 2015.
In May 2014, the FASB issued Accounting Standards Codification (“ASC”) Topic 606, Revenue from Contracts with
Customers, which supersedes ASC 605, Revenue Recognition. The new standard requires companies to recognize revenues
upon transfer of goods or services to customers in amounts that reflect the consideration which the company expects to receive
in exchange for those goods or services. In July 2015, the FASB delayed the effective date of the standard by one year. The new
guidance is effective for financial statements issued for annual reporting periods beginning after December 15, 2017 and early
application is not permitted before the original effective date of annual reporting periods beginning after December 15, 2016.
We are currently evaluating the impact of this standard on our consolidated financial statements.
2. Fair value measurements
Financial assets accounted for at fair value on a recurring basis include cash equivalents of $1,795.5 million and
$427.8 million and trading securities (included in other assets and consisting primarily of mutual funds) of $26.8 million and
$25.3 million at December 31, 2015 and 2014, respectively. These assets are carried at fair value based on quoted prices in
active markets for identical securities (Level 1). Cash equivalents include investments in AAA-rated money market mutual
funds with maturities of less than 90 days.
The fair values of cash and cash equivalents and investments (Level 1), accounts receivable, claims and rebates
payable, and accounts payable approximate carrying values due to the short-term maturities of these instruments. The fair
values, which approximate the carrying values, of our 2015 two-year term loan, 2015 five-year term loan and 2011 term loan
(Level 2) (as defined in Note 6 - Financing) were estimated using the current market rates for debt with similar maturities. The
fair values of our senior notes are $11,078.0 million and $12,884.4 million as of December 31, 2015 and 2014, respectively.
See Note 6 - Financing for further discussion of the carrying values of our debt.
The fair values of our senior notes were estimated based on observable market information (Level 2). In determining
the fair values of liabilities, we took into consideration the risk of nonperformance. Nonperformance risk refers to the risk the
obligation will not be fulfilled and affects the value at which the liability would be transferred to a market participant. This risk
did not have a material impact on the fair values of our liabilities.
3. Dispositions
Sale of our acute infusion therapies line of business. In 2013, we sold our acute infusion therapies line of business,
which was included in our PBM segment before being classified as a discontinued operation. We recognized a gain on the sale
of this business, net of the sale of its assets, of $0.5 million. We also recorded an impairment charge of $32.9 million, which
reflected goodwill impairment and the subsequent write-down to fair market value. The gain and the impairment charge are
included in the “Net loss from discontinued operations, net of tax” line item in our consolidated statement of operations for the
year ended December 31, 2013.
Sale of portions of UBC. In 2013, we sold various portions of our UBC business, which were included in our Other
Business Operations segment before being classified as discontinued operations. We recognized a total gain on the sale of these
businesses, net of the sale of its assets, of $51.8 million, which is included in the “Net loss from discontinued operations, net of
tax” line item in our consolidated statement of operations for the year ended December 31, 2013.
Disposition of Europe. During 2014, we substantially shut down our European operations, which were included in our
Other Business Operations segment before being classified as a discontinued operation.