Medco 2015 Annual Report Download - page 63
Download and view the complete annual report
Please find page 63 of the 2015 Medco annual report below. You can navigate through the pages in the report by either clicking on the pages listed below, or by using the keyword search tool below to find specific information within the annual report.-
 1
1 -
2
-
3
-
4
-
5
-
6
-
7
-
8
-
9
-
10
-
11
-
12
-
13
-
14
-
15
-
16
-
17
-
18
-
19
-
20
-
21
-
22
-
23
-
24
-
25
-
26
-
27
-
28
-
29
-
30
-
31
-
32
-
33
-
34
-
35
-
36
-
37
-
38
-
39
-
40
-
41
-
42
-
43
-
44
-
45
-
46
-
47
-
48
-
49
-
50
-
51
-
52
-
 53
53 -
 54
54 -
 55
55 -
 56
56 -
 57
57 -
 58
58 -
 59
59 -
 60
60 -
 61
61 -
 62
62 -
 63
63 -
 64
64 -
 65
65 -
 66
66 -
 67
67 -
 68
68 -
 69
69 -
 70
70 -
 71
71 -
 72
72 -
 73
73 -
74
-
75
-
76
-
77
-
78
-
79
-
80
-
81
-
82
-
83
-
84
-
85
-
86
-
87
-
88
-
89
-
90
-
91
-
92
-
93
-
94
-
95
-
96
-
97
-
98
-
99
-
100
 |
 |
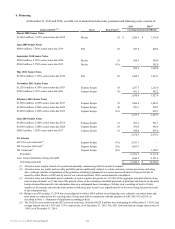
61 Express Scripts 2015 Annual Report
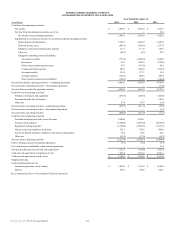
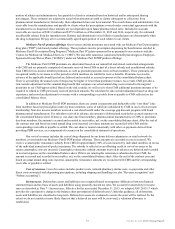
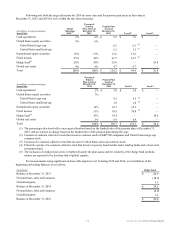
5. Goodwill and other intangible assets
Following is a summary of our goodwill and other intangible assets for our two reportable segments, PBM and Other
Business Operations.
December 31, 2015 December 31, 2014
(in millions)
Gross Carrying
Amount
Accumulated
Amortization
Net Carrying
Amount
Gross Carrying
Amount
Accumulated
Amortization
Net Carrying
Amount
Goodwill
PBM $ 29,286.7 $ (106.8) $ 29,179.9 $ 29,290.6 $ (107.1) $ 29,183.5
Other Business Operations 97.4 — 97.4 97.4 — 97.4
$ 29,384.1 $ (106.8) $ 29,277.3 $ 29,388.0 $ (107.1) $ 29,280.9
Other intangible assets
PBM
Customer contracts $ 17,570.3 $ (7,290.0) $ 10,280.3 $ 17,571.4 $ (5,603.2) $ 11,968.2
Trade names 226.6 (83.6) 143.0 226.6 (61.3) 165.3
Miscellaneous(1) 8.7 (6.5) 2.2 8.7 (4.8) 3.9
17,805.6 (7,380.1) 10,425.5 17,806.7 (5,669.3) 12,137.4
Other Business Operations
Customer relationships 120.1 (98.1) 22.0 120.2 (82.6) 37.6
Trade names 35.7 (13.5) 22.2 35.8 (9.9) 25.9
155.8 (111.6) 44.2 156.0 (92.5) 63.5
Total other intangible assets $ 17,961.4 $ (7,491.7) $ 10,469.7 $ 17,962.7 $ (5,761.8) $ 12,200.9
(1) Balances as of December 31, 2014 have been adjusted to reflect $54.3 million of net financing costs related to our
senior notes, term loans and revolving facilities as a reduction in the carrying value of long-term debt and other assets,
as applicable, in conjunction with the adoption of ASU 2015-03 and ASU 2015-15, as described in Note 1 - Summary
of significant accounting policies.
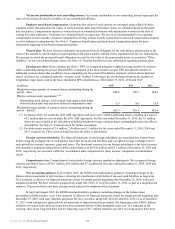
Following is a summary of the change in the net carrying value of goodwill by reportable segment:
(in millions) PBM
Other Business
Operations Total
Balance at December 31, 2013 $ 29,208.0 $ 97.4 $ 29,305.4
Purchase price allocation adjustment(1) (22.5)—
(22.5)
Foreign currency translation (2.0)—
(2.0)
Balance at December 31, 2014 $ 29,183.5 $ 97.4 $ 29,280.9
Foreign currency translation (3.6)—
(3.6)
Balance at December 31, 2015 $ 29,179.9 $ 97.4 $ 29,277.3
(1) Goodwill has been adjusted to correct certain deferred taxes related to prior acquisitions.
The aggregate amount of amortization expense of other intangible assets for our continuing operations was $1,730.9
million, $1,753.5 million and $2,018.2 million for the years ended December 31, 2015, 2014 and 2013, respectively. Included
in total amortization expense is $95.1 million, $112.4 million and $114.0 million for customer contracts related to a PBM
agreement which is included as an offset to revenues for the years ended December 31, 2015, 2014 and 2013, respectively.
Following is a summary of the expected aggregate amortization of other intangible assets as of December 31, 2015 (in
millions):
Year Ended December 31,
Future
Amortization
2016 $ 1,727.0
2017 1,319.0
2018 1,309.0
2019 1,303.0
2020 857.0