Medco 2015 Annual Report Download - page 39
Download and view the complete annual report
Please find page 39 of the 2015 Medco annual report below. You can navigate through the pages in the report by either clicking on the pages listed below, or by using the keyword search tool below to find specific information within the annual report.-
 1
1 -
2
-
3
-
4
-
5
-
6
-
7
-
8
-
9
-
10
-
11
-
12
-
13
-
14
-
15
-
16
-
17
-
18
-
19
-
20
-
21
-
22
-
23
-
24
-
25
-
26
-
27
-
28
-
 29
29 -
 30
30 -
 31
31 -
 32
32 -
 33
33 -
 34
34 -
 35
35 -
 36
36 -
 37
37 -
 38
38 -
 39
39 -
 40
40 -
 41
41 -
 42
42 -
 43
43 -
 44
44 -
 45
45 -
 46
46 -
 47
47 -
 48
48 -
 49
49 -
50
-
51
-
52
-
53
-
54
-
55
-
56
-
57
-
58
-
59
-
60
-
61
-
62
-
63
-
64
-
65
-
66
-
67
-
68
-
69
-
70
-
71
-
72
-
73
-
74
-
75
-
76
-
77
-
78
-
79
-
80
-
81
-
82
-
83
-
84
-
85
-
86
-
87
-
88
-
89
-
90
-
91
-
92
-
93
-
94
-
95
-
96
-
97
-
98
-
99
-
100
 |
 |

37 Express Scripts 2015 Annual Report
2014, our European operations were substantially shut down. During 2013, we sold our acute infusion therapies line of business
and various portions of our UBC line of business. Our acute infusion therapies line of business was previously included in our
PBM segment and the remaining businesses were previously included in our Other Business Operations segment. The results of
operations for these businesses were reported as discontinued operations and excluded from all periods presented in the
information provided below.
Throughout the description below, reference is made to the impact of generic fill rates. Generally, higher generic fill
rates reduce PBM revenues, as generic drugs are generally priced lower than branded drugs. However, as ingredient cost on
generic drugs is incrementally lower than the price charged, higher generic fill rates generally have a favorable impact on gross
profit.
The home delivery generic fill rate is currently lower than the network generic fill rate as fewer generic substitutions
are available among maintenance medications (e.g., therapies for chronic conditions) commonly dispensed from home delivery
pharmacies as compared to acute medications which are primarily dispensed by pharmacies in our retail networks.
In 2011, Medco Health Solutions, Inc. (“Medco”) announced its pharmacy benefit services agreement with
UnitedHealth Group would not be renewed; although we continued to provide service under an agreement which expired on
December 31, 2012. A transition agreement was in place throughout 2013, during which time patients moved in tranches off of
the Medco platform. Due to this transition of UnitedHealth Group, claims volume and related revenues and cost of revenues
decreased throughout 2013.
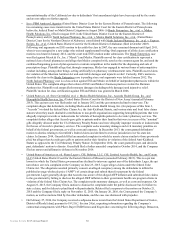
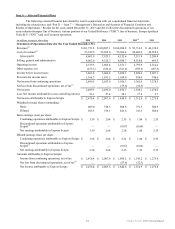
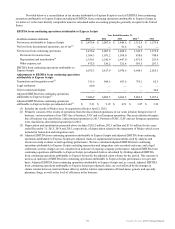
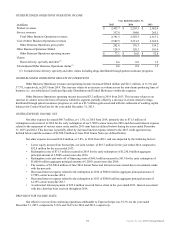
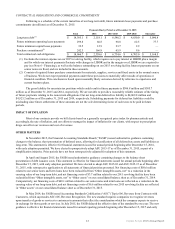
PBM OPERATING INCOME
Year Ended December 31,
(in millions) 2015 2014 2013
Product revenues:
Network revenues(1) $ 56,472.6 $ 58,468.6 $ 63,244.4
Home delivery and specialty revenues(2) 40,830.1 38,633.0 37,571.1
Service revenues 1,657.6 1,278.0 966.2
Total PBM revenues 98,960.3 98,379.6 101,781.7
Cost of PBM revenues(1) 90,760.4 90,630.8 93,803.5
PBM gross profit 8,199.9 7,748.8 7,978.2
PBM SG&A 3,937.7 4,202.4 4,479.3
PBM operating income $ 4,262.2 $ 3,546.4 $ 3,498.9
Claims
Network—continuing operations 922.2 933.6 1,065.3
Home delivery and specialty—continuing operations(2) 121.0 127.7 139.7
Total PBM claims—continuing operations 1,043.2 1,061.3 1,205.0
Adjusted network(3) 942.8 933.6 1,065.3
Adjusted home delivery and specialty(2)(3) 355.2 375.4 411.2
Total adjusted PBM claims—continuing operations(3) 1,298.0 1,309.0 1,476.5
Home delivery and specialty—discontinued operations — — 0.4
Total PBM claims—discontinued operations — — 0.4
Total adjusted PBM claims—discontinued operations — — 0.4
(1) Includes retail pharmacy co-payments of $9,170.0 million, $10,272.7 million and $12,620.3 million for the years ended
December 31, 2015, 2014 and 2013, respectively.
(2) Includes home delivery and specialty claims including drugs we distribute to other PBMs’ clients under limited
distribution contracts with pharmaceutical manufacturers and Freedom Fertility claims.
(3) Includes an adjustment to certain network claims to reflect an approximate 30-day equivalent fill and reflects home
delivery claims multiplied by 3, as home delivery claims typically cover a time period 3 times longer than network
claims.