Medco 2015 Annual Report Download - page 78
Download and view the complete annual report
Please find page 78 of the 2015 Medco annual report below. You can navigate through the pages in the report by either clicking on the pages listed below, or by using the keyword search tool below to find specific information within the annual report.-
 1
1 -
2
-
3
-
4
-
5
-
6
-
7
-
8
-
9
-
10
-
11
-
12
-
13
-
14
-
15
-
16
-
17
-
18
-
19
-
20
-
21
-
22
-
23
-
24
-
25
-
26
-
27
-
28
-
29
-
30
-
31
-
32
-
33
-
34
-
35
-
36
-
37
-
38
-
39
-
40
-
41
-
42
-
43
-
44
-
45
-
46
-
47
-
48
-
49
-
50
-
51
-
52
-
53
-
54
-
55
-
56
-
57
-
58
-
59
-
60
-
61
-
62
-
63
-
64
-
65
-
66
-
67
-
 68
68 -
 69
69 -
 70
70 -
 71
71 -
 72
72 -
 73
73 -
 74
74 -
 75
75 -
 76
76 -
 77
77 -
 78
78 -
 79
79 -
 80
80 -
 81
81 -
 82
82 -
 83
83 -
 84
84 -
 85
85 -
 86
86 -
 87
87 -
 88
88 -
89
-
90
-
91
-
92
-
93
-
94
-
95
-
96
-
97
-
98
-
99
-
100
 |
 |

76
Express Scripts 2015 Annual Report
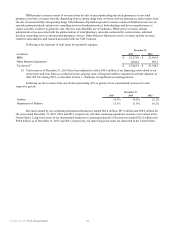
PBM product revenues consist of revenues from the sale of prescription drugs by retail pharmacies in our retail
pharmacy networks, revenues from the dispensing of prescription drugs from our home delivery pharmacies and revenues from
the sale of certain fertility and specialty drugs. Other Business Operations product revenues consist of distribution services of
specialty pharmaceuticals and provide consulting services for pharmaceutical, biotechnology and device manufacturers to
collect scientific evidence to guide the safe, effective and affordable use of medicines. PBM service revenues include
administrative fees associated with the administration of retail pharmacy networks contracted by certain clients, informed
decision counseling services and specialty pharmacy services. Other Business Operations service revenues include revenues
related to data analytics and research associated with our UBC business.
Following is the summary of total assets by reportable segment:
December 31,
(in millions) 2015 2014
PBM $ 52,174.9 $ 52,841.0
Other Business Operations 1,068.4 907.3
Total assets(1) $ 53,243.3 $ 53,748.3
(1) Total assets as of December 31, 2014 have been adjusted to reflect $50.6 million of net financing costs related to our
senior notes and term loans as a reduction in the carrying value of long-term debt in conjunction with the adoption of
ASU 2015-03 during 2015, as described in Note 1 - Summary of significant accounting policies.
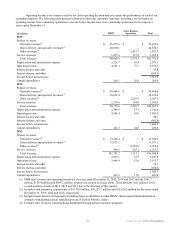
Following are the revenues from our clients representing 10% or greater of our consolidated revenues for each
respective period:
December 31,
2015 2014 2013
Anthem 16.3% 14.0% 12.2%
Department of Defense 13.1% 11.9% 10.2%
Revenues earned by our continuing international businesses totaled $82.0 million, $87.3 million and $98.6 million for
the years ended December 31, 2015, 2014 and 2013, respectively. All other continuing operations revenues were earned in the
United States. Long-lived assets of our international businesses (consisting primarily of fixed assets) totaled $21.8 million and
$56.0 million as of December 31, 2015 and 2014, respectively. All other long-lived assets are domiciled in the United States.