Medco 2015 Annual Report Download - page 62
Download and view the complete annual report
Please find page 62 of the 2015 Medco annual report below. You can navigate through the pages in the report by either clicking on the pages listed below, or by using the keyword search tool below to find specific information within the annual report.-
 1
1 -
2
-
3
-
4
-
5
-
6
-
7
-
8
-
9
-
10
-
11
-
12
-
13
-
14
-
15
-
16
-
17
-
18
-
19
-
20
-
21
-
22
-
23
-
24
-
25
-
26
-
27
-
28
-
29
-
30
-
31
-
32
-
33
-
34
-
35
-
36
-
37
-
38
-
39
-
40
-
41
-
42
-
43
-
44
-
45
-
46
-
47
-
48
-
49
-
50
-
51
-
 52
52 -
 53
53 -
 54
54 -
 55
55 -
 56
56 -
 57
57 -
 58
58 -
 59
59 -
 60
60 -
 61
61 -
 62
62 -
 63
63 -
 64
64 -
 65
65 -
 66
66 -
 67
67 -
 68
68 -
 69
69 -
 70
70 -
 71
71 -
 72
72 -
73
-
74
-
75
-
76
-
77
-
78
-
79
-
80
-
81
-
82
-
83
-
84
-
85
-
86
-
87
-
88
-
89
-
90
-
91
-
92
-
93
-
94
-
95
-
96
-
97
-
98
-
99
-
100
 |
 |

60
Express Scripts 2015 Annual Report
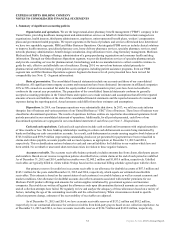
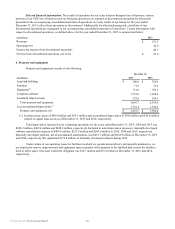
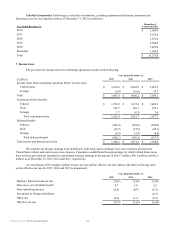
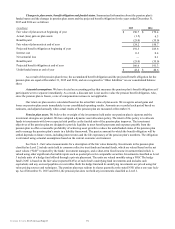
Selected financial information. The results of operations for our acute infusion therapies line of business, various
portions of our UBC line of business and our European operations are reported as discontinued operations for all periods
presented in the accompanying consolidated statement of operations. As such, results of operations for the year ended
December 31, 2013 reflect these operations as discontinued. Additionally, for all periods presented, cash flows of our
discontinued operations are segregated in our accompanying consolidated statement of cash flows. Certain information with
respect to discontinued operations, as defined above, for the year ended December 31, 2013 is summarized below:
(in millions) 2013
Revenues $ 521.2
Operating loss 24.9
Income tax expense from discontinued operations 28.7
Net loss from discontinued operations, net of tax $ 53.6
4. Property and equipment
Property and equipment consists of the following:
December 31,
(in millions) 2015 2014
Land and buildings $ 200.0 $ 224.0
Furniture 71.9 72.8
Equipment(1) 773.0 785.1
Computer software 1,733.8 1,638.6
Leasehold improvements 229.0 194.1
Total property and equipment 3,007.7 2,914.6
Less accumulated depreciation(1) 1,716.4 1,330.6
Property and equipment, net $ 1,291.3 $ 1,584.0
(1) Includes gross assets of $50.4 million and $58.1 million and accumulated depreciation of $9.0 million and $16.8 million
related to capital lease assets as of December 31, 2015 and 2014, respectively.
Total depreciation expense for our continuing operations for the years ended December 31, 2015, 2014 and 2013 was
$628.2 million, $489.4 million and $428.8 million, respectively. Included in total depreciation expense is internally developed
software amortization expense of $409.4 million, $232.9 million and $205.0 million in 2015, 2014 and 2013, respectively.
Internally developed software, net of accumulated amortization, was $433.7 million and $664.9 million at December 31, 2015
and 2014, respectively. We capitalized $172.8 million of internally developed software during 2015.
Under certain of our operating leases for facilities in which we operate home delivery and specialty pharmacies, we
are required to remove improvements and equipment upon surrender of the property to the landlord and convert the facilities
back to office space. Our asset retirement obligation was $14.7 million and $15.8 million at December 31, 2015 and 2014,
respectively.