Medco 2015 Annual Report Download - page 79
Download and view the complete annual report
Please find page 79 of the 2015 Medco annual report below. You can navigate through the pages in the report by either clicking on the pages listed below, or by using the keyword search tool below to find specific information within the annual report.-
 1
1 -
2
-
3
-
4
-
5
-
6
-
7
-
8
-
9
-
10
-
11
-
12
-
13
-
14
-
15
-
16
-
17
-
18
-
19
-
20
-
21
-
22
-
23
-
24
-
25
-
26
-
27
-
28
-
29
-
30
-
31
-
32
-
33
-
34
-
35
-
36
-
37
-
38
-
39
-
40
-
41
-
42
-
43
-
44
-
45
-
46
-
47
-
48
-
49
-
50
-
51
-
52
-
53
-
54
-
55
-
56
-
57
-
58
-
59
-
60
-
61
-
62
-
63
-
64
-
65
-
66
-
67
-
68
-
 69
69 -
 70
70 -
 71
71 -
 72
72 -
 73
73 -
 74
74 -
 75
75 -
 76
76 -
 77
77 -
 78
78 -
 79
79 -
 80
80 -
 81
81 -
 82
82 -
 83
83 -
 84
84 -
 85
85 -
 86
86 -
 87
87 -
 88
88 -
 89
89 -
90
-
91
-
92
-
93
-
94
-
95
-
96
-
97
-
98
-
99
-
100
 |
 |

77 Express Scripts 2015 Annual Report
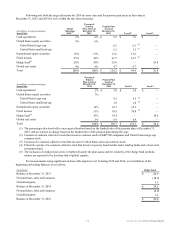
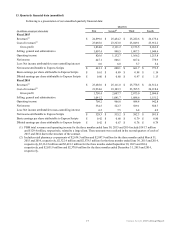
13. Quarterly financial data (unaudited)
Following is a presentation of our unaudited quarterly financial data:
Quarters
(in millions, except per share data) First Second(1) Third Fourth
Fiscal 2015
Revenues(2) $ 24,899.6 $ 25,454.2 $ 25,222.6 $ 26,175.4
Cost of revenues(2) 23,065.6 23,323.0 23,049.1 23,912.2
Gross profit 1,834.0 2,131.2 2,173.5 2,263.2
Selling, general and administrative 1,007.4 998.5 1,007.3 1,049.4
Operating income 826.6 1,132.7 1,166.2 1,213.8
Net income 447.1 606.1 667.4 778.9
Less: Net income attributable to non-controlling interest 6.0 6.0 5.7 5.4
Net income attributable to Express Scripts $ 441.1 $ 600.1 $ 661.7 $ 773.5
Basic earnings per share attributable to Express Scripts $ 0.61 $ 0.89 $ 0.98 $ 1.14
Diluted earnings per share attributable to Express Scripts $ 0.60 $ 0.88 $ 0.97 $ 1.13
Fiscal 2014
Revenues(2) $ 23,685.0 $ 25,111.0 $ 25,778.5 $ 26,312.6
Cost of revenues(2) 21,934.6 23,103.3 23,705.5 24,218.6
Gross profit 1,750.4 2,007.7 2,073.0 2,094.0
Selling, general and administrative 1,041.2 1,041.7 1,088.6 1,151.2
Operating income 709.2 966.0 984.4 942.8
Net income 334.5 522.7 589.1 588.7
Less: Net income attributable to non-controlling interest 6.2 7.5 6.8 6.9
Net income attributable to Express Scripts $ 328.3 $ 515.2 $ 582.3 $ 581.8
Basic earnings per share attributable to Express Scripts $ 0.42 $ 0.68 $ 0.79 $ 0.80
Diluted earnings per share attributable to Express Scripts $ 0.42 $ 0.67 $ 0.78 $ 0.79
(1) PBM total revenues and operating income for the three months ended June 30, 2015 and 2014 include $141.7 million
and $129.4 million, respectively, related to a large client. These amounts were realized in the second quarters of each of
2015 and 2014 due to the structure of the contract.
(2) Includes retail pharmacy co-payments of $2,634.3 million and $2,897.9 million for the three months ended March 31,
2015 and 2014, respectively, $2,322.4 million and $2,578.5 million for the three months ended June 30, 2015 and 2014,
respectively, $2,161.5 million and $2,418.3 million for the three months ended September 30, 2015 and 2014,
respectively, and $2,051.8 million and $2,378.0 million for the three months ended December 31, 2015 and 2014,
respectively.