Mattel 2015 Annual Report Download - page 97
Download and view the complete annual report
Please find page 97 of the 2015 Mattel annual report below. You can navigate through the pages in the report by either clicking on the pages listed below, or by using the keyword search tool below to find specific information within the annual report.-
 1
1 -
2
-
3
-
4
-
5
-
6
-
7
-
8
-
9
-
10
-
11
-
12
-
13
-
14
-
15
-
16
-
17
-
18
-
19
-
20
-
21
-
22
-
23
-
24
-
25
-
26
-
27
-
28
-
29
-
30
-
31
-
32
-
33
-
34
-
35
-
36
-
37
-
38
-
39
-
40
-
41
-
42
-
43
-
44
-
45
-
46
-
47
-
48
-
49
-
50
-
51
-
52
-
53
-
54
-
55
-
56
-
57
-
58
-
59
-
60
-
61
-
62
-
63
-
64
-
65
-
66
-
67
-
68
-
69
-
70
-
71
-
72
-
73
-
74
-
75
-
76
-
77
-
78
-
79
-
80
-
81
-
82
-
83
-
84
-
85
-
86
-
 87
87 -
 88
88 -
 89
89 -
 90
90 -
 91
91 -
 92
92 -
 93
93 -
 94
94 -
 95
95 -
 96
96 -
 97
97 -
 98
98 -
 99
99 -
 100
100 -
 101
101 -
 102
102 -
 103
103 -
 104
104 -
 105
105 -
 106
106 -
 107
107 -
108
-
109
-
110
-
111
-
112
-
113
-
114
-
115
 |
 |

93
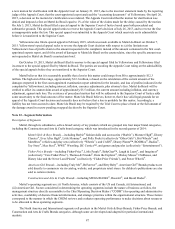
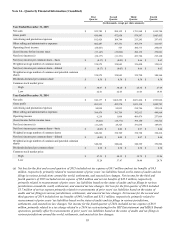
Note 14—Quarterly Financial Information (Unaudited)
First
Quarter
Second
Quarter
Third
Quarter
Fourth
Quarter
(In thousands, except per share amounts)
Year Ended December 31, 2015
Net sales $ 922,749 $ 988,152 $ 1,791,968 $ 1,999,744
Gross profit 450,448 472,858 879,597 1,003,455
Advertising and promotion expenses 102,428 104,744 213,245 297,435
Other selling and administrative expenses 402,487 367,551 365,579 411,967
Operating (loss) income (54,467) 563 300,773 294,053
(Loss) Income before income taxes (73,147) (19,898) 286,139 270,821
Net (loss) income (a) (58,177) (11,351) 223,784 215,160
Net (loss) income per common share—basic $ (0.17) $ (0.03) $ 0.66 $ 0.63
Weighted average number of common shares 338,579 338,843 339,420 339,815
Net (loss) income per common share—diluted $ (0.17) $ (0.03) $ 0.66 $ 0.63
Weighted average number of common and potential common
shares 338,579 338,843 339,790 340,364
Dividends declared per common share $ 0.38 $ 0.38 $ 0.38 $ 0.38
Common stock market price:
High $ 30.47 $ 30.20 $ 26.34 $ 27.69
Low 22.61 22.65 21.03 19.83
Year Ended December 31, 2014
Net sales $ 946,177 $ 1,062,252 $ 2,021,424 $ 1,993,966
Gross profit 481,531 492,570 1,021,138 1,005,783
Advertising and promotion expenses 90,834 99,853 218,746 323,810
Other selling and administrative expenses 384,479 391,709 392,913 444,964
Operating income 6,218 1,008 409,479 237,009
(Loss) Income before income taxes (9,421) (14,371) 394,180 216,522
Net (loss) income (a) (11,218) 28,325 331,836 149,931
Net (loss) income per common share—basic $ (0.03) $ 0.08 $ 0.97 $ 0.44
Weighted average number of common shares 340,226 338,709 338,728 338,416
Net (loss) income per common share—diluted $ (0.03) $ 0.08 $ 0.97 $ 0.44
Weighted average number of common and potential common
shares 340,226 340,644 340,329 339,506
Dividends declared per common share $ 0.38 $ 0.38 $ 0.38 $ 0.38
Common stock market price:
High $ 47.39 $ 40.32 $ 39.79 $ 31.86
Low 35.24 37.47 30.48 28.78
(a) Net loss for the first and second quarters of 2015 included net tax expense of $0.7 million and net tax benefits of $4.3
million, respectively, primarily related to reassessments of prior years’ tax liabilities based on the status of audits and tax
filings in various jurisdictions around the world, settlements, and enacted law changes. Net income for the third and
fourth quarters of 2015 included net tax expense of $0.8 million and net tax benefits of $16.3 million, respectively,
primarily related to reassessments of prior years’ tax liabilities based on the status of audits and tax filings in various
jurisdictions around the world, settlements, and enacted tax law changes. Net loss for the first quarter of 2014 included
$3.7 million of net tax expense primarily related to reassessments of prior years’ tax liabilities based on the status of
audits and tax filings in various jurisdictions, settlements, and enacted tax law changes. Net income for the second and
third quarters of 2014 included net tax benefits of $40.1 million and $15.1 million, respectively, primarily related to
reassessments of prior years’ tax liabilities based on the status of audits and tax filings in various jurisdictions,
settlements, and enacted tax law changes. Net income for the fourth quarter of 2014 included net tax expense of $8.9
million, primarily related to a tax charge related to a 2014 tax restructuring for the HIT Entertainment and MEGA Brands
operations, partially offset by reassessments of prior years’ tax liabilities based on the status of audits and tax filings in
various jurisdictions around the world, settlements, and enacted tax law changes.