Mattel 2015 Annual Report Download - page 31
Download and view the complete annual report
Please find page 31 of the 2015 Mattel annual report below. You can navigate through the pages in the report by either clicking on the pages listed below, or by using the keyword search tool below to find specific information within the annual report.-
 1
1 -
2
-
3
-
4
-
5
-
6
-
7
-
8
-
9
-
10
-
11
-
12
-
13
-
14
-
15
-
16
-
17
-
18
-
19
-
20
-
 21
21 -
 22
22 -
 23
23 -
 24
24 -
 25
25 -
 26
26 -
 27
27 -
 28
28 -
 29
29 -
 30
30 -
 31
31 -
 32
32 -
 33
33 -
 34
34 -
 35
35 -
 36
36 -
 37
37 -
 38
38 -
 39
39 -
 40
40 -
 41
41 -
42
-
43
-
44
-
45
-
46
-
47
-
48
-
49
-
50
-
51
-
52
-
53
-
54
-
55
-
56
-
57
-
58
-
59
-
60
-
61
-
62
-
63
-
64
-
65
-
66
-
67
-
68
-
69
-
70
-
71
-
72
-
73
-
74
-
75
-
76
-
77
-
78
-
79
-
80
-
81
-
82
-
83
-
84
-
85
-
86
-
87
-
88
-
89
-
90
-
91
-
92
-
93
-
94
-
95
-
96
-
97
-
98
-
99
-
100
-
101
-
102
-
103
-
104
-
105
-
106
-
107
-
108
-
109
-
110
-
111
-
112
-
113
-
114
-
115
 |
 |

27
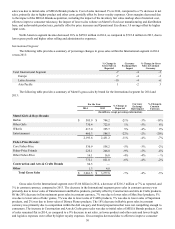
American Girl Segment
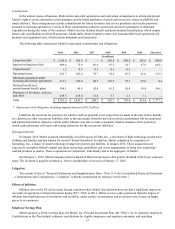
The following table provides a summary of Mattel’s gross sales by brand for the American Girl segment for 2015 and
2014:
For the Year % Change as
Reported
Currency
Exchange
Rate Impact
% Change in
Constant
Currency
2015 2014
(In millions, except percentage information)
American Girl Segment:
American Girl Brands $ 572.0 $ 618.7 -8%-1%-7%
Other Brands 24.2 26.6 -9%-11%2%
Total American Girl Segment $ 596.2 $ 645.3 -8%-1%-7%
Gross sales for the American Girl segment were $596.2 million in 2015, a decrease of $49.1 million or 8% as reported,
and 7% in constant currency, compared to 2014. Of the 7% decrease in American Girl Brands gross sales in constant currency,
4% was due to lower sales of the 2015 Girl of the Year, Grace Thomas™, and 4% was due to lower sales of Truly Me products.
Cost of sales decreased 6% in 2015, as compared to a 9% decrease in net sales, primarily due to lower product and other costs.
Gross margins decreased due to higher product-related costs, partially offset by Funding Our Future savings.
American Girl segment income decreased 38% to $69.9 million in 2015, as compared to $113.6 million in 2014,
primarily due to lower gross profit.
2014 Compared to 2013
Consolidated Results
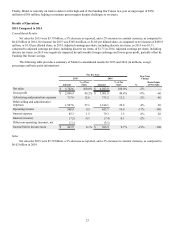
Net sales for 2014 were $6.02 billion, a 7% decrease as reported, and a 5% decrease in constant currency, as compared to
$6.48 billion in 2013. Net income for 2014 was $498.9 million, or $1.45 per diluted share, as compared to net income of $903.9
million, or $2.58 per diluted share, in 2013. Earnings per share for 2014 was negatively impacted by lower sales volume and
lower gross profit.
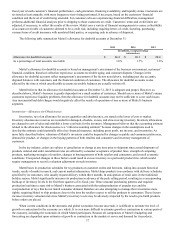
The following table provides a summary of Mattel’s consolidated results for 2014 and 2013 (in millions, except
percentage and basis point information):
For the Year Year/Year
Change
2014 2013
Amount
% of Net
Sales Amount
% of Net
Sales %
Basis Points
of Net Sales
Net sales $ 6,023.8 100.0% $ 6,484.9 100.0% -7%—
Gross profit $ 3,001.0 49.8% $ 3,478.9 53.6% -14% –380
Advertising and promotion expenses 733.2 12.2 750.2 11.6 -2%60
Other selling and administrative
expenses 1,614.1 26.8 1,560.6 24.1 3% 270
Operating income 653.7 10.9 1,168.1 18.0 -44% –710
Interest expense 79.3 1.3 78.5 1.2 1% 10
Interest (income) (7.4) -0.1 (5.6)-0.1 33% —
Other non-operating (income), net (5.1) (3.9)
Income before income taxes $ 586.9 9.7% $ 1,099.1 16.9% -47% –720
Sales
Net sales for 2014 were $6.02 billion, a 7% decrease as reported, and a 5% decrease in constant currency, as compared to
$6.48 billion in 2013.