Mattel 2015 Annual Report Download - page 58
Download and view the complete annual report
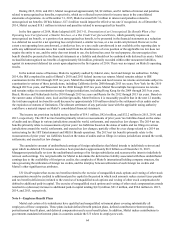
Please find page 58 of the 2015 Mattel annual report below. You can navigate through the pages in the report by either clicking on the pages listed below, or by using the keyword search tool below to find specific information within the annual report.-
 1
1 -
2
-
3
-
4
-
5
-
6
-
7
-
8
-
9
-
10
-
11
-
12
-
13
-
14
-
15
-
16
-
17
-
18
-
19
-
20
-
21
-
22
-
23
-
24
-
25
-
26
-
27
-
28
-
29
-
30
-
31
-
32
-
33
-
34
-
35
-
36
-
37
-
38
-
39
-
40
-
41
-
42
-
43
-
44
-
45
-
46
-
47
-
 48
48 -
 49
49 -
 50
50 -
 51
51 -
 52
52 -
 53
53 -
 54
54 -
 55
55 -
 56
56 -
 57
57 -
 58
58 -
 59
59 -
 60
60 -
 61
61 -
 62
62 -
 63
63 -
 64
64 -
 65
65 -
 66
66 -
 67
67 -
 68
68 -
69
-
70
-
71
-
72
-
73
-
74
-
75
-
76
-
77
-
78
-
79
-
80
-
81
-
82
-
83
-
84
-
85
-
86
-
87
-
88
-
89
-
90
-
91
-
92
-
93
-
94
-
95
-
96
-
97
-
98
-
99
-
100
-
101
-
102
-
103
-
104
-
105
-
106
-
107
-
108
-
109
-
110
-
111
-
112
-
113
-
114
-
115
 |
 |

54
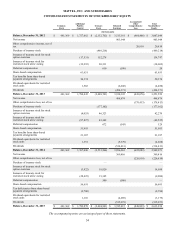
MATTEL, INC. AND SUBSIDIARIES
CONSOLIDATED STATEMENTS OF STOCKHOLDERS’ EQUITY
Common
Stock
Additional
Paid-In
Capital
Treasury
Stock
Retained
Earnings
Accumulated
Other
Comprehensive
Loss
Total
Stockholders’
Equity
(In thousands)
Balance, December 31, 2012 $ 441,369 $ 1,727,682 $ (2,152,702) $ 3,515,181 $ (464,486) $ 3,067,044
Net income 903,944 903,944
Other comprehensive income, net of
tax 20,810 20,810
Purchase of treasury stock (469,218) (469,218)
Issuance of treasury stock for stock
option exercises (17,531) 152,278 134,747
Issuance of treasury stock for
restricted stock units vesting (39,293) 20,331 (18,962)
Deferred compensation 610 (590) 20
Share-based compensation 61,651 61,651
Tax benefits from share-based
payment arrangements 50,374 50,374
Dividend equivalents for restricted
stock units 1,562 (6,042) (4,480)
Dividends (494,371) (494,371)
Balance, December 31, 2013 441,369 1,784,445 (2,448,701) 3,918,122 (443,676) 3,251,559
Net income 498,874 498,874
Other comprehensive loss, net of tax (178,413) (178,413)
Purchase of treasury stock (177,162) (177,162)
Issuance of treasury stock for stock
option exercises (4,053) 46,323 42,270
Issuance of treasury stock for
restricted stock units vesting (87,827) 45,302 (42,525)
Deferred compensation 672 (543) 129
Share-based compensation 51,993 51,993
Tax benefits from share-based
payment arrangements 21,187 21,187
Dividend equivalents for restricted
stock units 1,351 (5,379) (4,028)
Dividends (514,813) (514,813)
Balance, December 31, 2014 441,369 1,767,096 (2,533,566) 3,896,261 (622,089) 2,949,071
Net income 369,416 369,416
Other comprehensive loss, net of tax (226,810) (226,810)
Purchase of treasury stock ——
Issuance of treasury stock for stock
option exercises (3,822) 18,820 14,998
Issuance of treasury stock for
restricted stock units vesting (28,425) 19,345 (9,080)
Deferred compensation 500 (500) —
Share-based compensation 56,691 56,691
Tax deficiencies from share-based
payment arrangements (2,780) (2,780)
Dividend equivalents for restricted
stock units 1,110 (4,289) (3,179)
Dividends (515,073) (515,073)
Balance, December 31, 2015 $ 441,369 $ 1,789,870 $ (2,494,901) $ 3,745,815 $ (848,899) $ 2,633,254
The accompanying notes are an integral part of these statements.