Mattel 2015 Annual Report Download - page 81
Download and view the complete annual report
Please find page 81 of the 2015 Mattel annual report below. You can navigate through the pages in the report by either clicking on the pages listed below, or by using the keyword search tool below to find specific information within the annual report.-
 1
1 -
2
-
3
-
4
-
5
-
6
-
7
-
8
-
9
-
10
-
11
-
12
-
13
-
14
-
15
-
16
-
17
-
18
-
19
-
20
-
21
-
22
-
23
-
24
-
25
-
26
-
27
-
28
-
29
-
30
-
31
-
32
-
33
-
34
-
35
-
36
-
37
-
38
-
39
-
40
-
41
-
42
-
43
-
44
-
45
-
46
-
47
-
48
-
49
-
50
-
51
-
52
-
53
-
54
-
55
-
56
-
57
-
58
-
59
-
60
-
61
-
62
-
63
-
64
-
65
-
66
-
67
-
68
-
69
-
70
-
 71
71 -
 72
72 -
 73
73 -
 74
74 -
 75
75 -
 76
76 -
 77
77 -
 78
78 -
 79
79 -
 80
80 -
 81
81 -
 82
82 -
 83
83 -
 84
84 -
 85
85 -
 86
86 -
 87
87 -
 88
88 -
 89
89 -
 90
90 -
 91
91 -
92
-
93
-
94
-
95
-
96
-
97
-
98
-
99
-
100
-
101
-
102
-
103
-
104
-
105
-
106
-
107
-
108
-
109
-
110
-
111
-
112
-
113
-
114
-
115
 |
 |

77
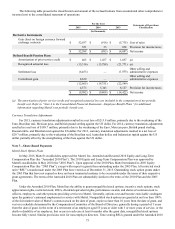
The intrinsic value of a stock option is the amount by which the current market value of the underlying stock exceeds the
exercise price of an option. The total intrinsic value of options exercised during 2015, 2014, and 2013 was $4.9 million, $24.1
million, and $156.6 million, respectively. At December 31, 2015, options outstanding had an intrinsic value of $49.7 million,
with a weighted average remaining life of 7.9 years. At December 31, 2015, options exercisable had an intrinsic value of $16.3
million, with a weighted average remaining life of 6.0 years. At December 31, 2015, stock options vested or expected to vest
totaled 17.6 million shares, with a total intrinsic value of $48.3 million, weighted average exercise price of $27.48, and
weighted average remaining life of 7.9 years. During 2015, approximately 2 million stock options vested. The total grant date
fair value of stock options vested during 2015, 2014, and 2013 was approximately $12 million, $12 million, and $13 million,
respectively.
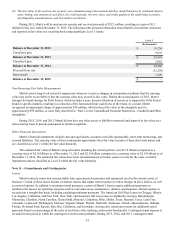
Mattel uses treasury shares purchased under its share repurchase program to satisfy stock option exercises. Cash received
from stock options exercised during 2015, 2014, and 2013 was $15.0 million, $43.3 million, and $134.5 million, respectively.
Restricted Stock Units
RSUs are valued at the market value on the date of grant and the expense is evenly attributed to the periods in which the
restrictions lapse, which is generally 3 years from the date of grant.
Compensation expense recognized related to grants of RSUs, excluding Performance RSUs, was $41.5 million, $39.5
million, and $38.2 million in 2015, 2014, and 2013, respectively, and is included within other selling and administrative
expenses in the consolidated statements of operations. Income tax benefits related to RSU compensation expense recognized in
the consolidated statements of operations during 2015, 2014, and 2013 totaled $11.0 million, $10.6 million, and $10.6 million,
respectively.
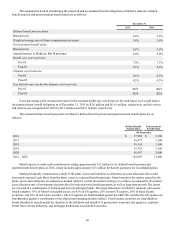
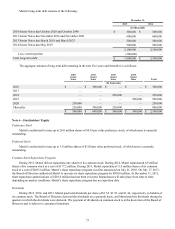
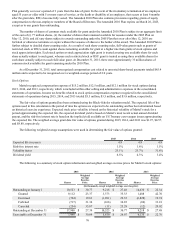
The following is a summary of RSU information and weighted average grant date fair values for Mattel’s RSUs,
excluding Performance RSUs:
2015 2014 2013
Shares
Weighted
Average
Grant Date
Fair Value Shares
Weighted
Average
Grant Date
Fair Value Shares
Weighted
Average
Grant Date
Fair Value
(In thousands, except weighted average grant date fair value)
Unvested at January 1 3,173 $ 37.10 3,036 $ 34.94 3,505 $ 28.24
Granted 2,332 23.54 1,786 34.83 1,116 42.82
Vested (1,159) 37.29 (1,426) 29.77 (1,337) 24.53
Forfeited (608) 34.67 (223) 36.27 (248) 31.82
Unvested at December 31 3,738 $ 28.98 3,173 $ 37.10 3,036 $ 34.94
At December 31, 2015, RSUs expected to vest totaled 3.6 million shares, with a weighted average grant date fair value of
$29.11. The total grant date fair value of RSUs vested during 2015, 2014, and 2013 was $43.2 million, $42.5 million, and $32.8
million, respectively.
Mattel recognized compensation expense of $11.4 million during 2013 for Performance RSUs granted in connection with
its January 1, 2011–December 31, 2013 LTIP performance cycle, more fully described in “Note 4 to the Consolidated Financial
Statements—Employee Benefit Plans.” Income tax benefits related to Performance RSU compensation expense recognized in
the consolidated statements of operations during 2013 totaled $4.2 million.
During 2014, no compensation expense and no related income tax benefit was recognized for Performance RSUs granted
in connection with its January 1, 2014 - December 31, 2016 LTIP performance cycle as actual results did not meet minimum
performance thresholds. In 2015, no compensation expense and no related income tax benefit was recognized as it is not
probable that shares will be earned for the 2014-2016 performance cycle, since the downward adjustment from the 2014-2016
market-related component is expected to offset any shares earned for the 2014-2016 performance-related component. This is
also more fully described in “Note 4 to the Consolidated Financial Statements—Employee Benefit Plans.”
Note 8—Earnings Per Share
Unvested share-based payment awards that contain nonforfeitable rights to dividends or dividend equivalents (whether
paid or unpaid) are participating securities and are included in the computation of earnings per share pursuant to the two-class