JVC 1998 Annual Report Download - page 30
Download and view the complete annual report
Please find page 30 of the 1998 JVC annual report below. You can navigate through the pages in the report by either clicking on the pages listed below, or by using the keyword search tool below to find specific information within the annual report.-
 1
1 -
2
-
3
-
4
-
5
-
6
-
7
-
8
-
9
-
10
-
11
-
12
-
13
-
14
-
15
-
16
-
17
-
18
-
19
-
 20
20 -
 21
21 -
 22
22 -
 23
23 -
 24
24 -
 25
25 -
 26
26 -
 27
27 -
 28
28 -
 29
29 -
 30
30 -
 31
31 -
 32
32 -
 33
33 -
 34
34 -
 35
35 -
 36
36 -
 37
37 -
 38
38
 |
 |

28 JVC 1998
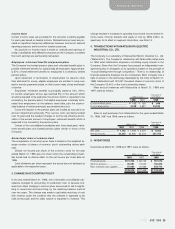
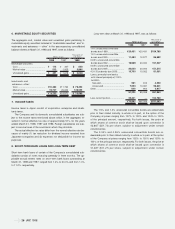
Information by segment for the years ended March 31, 1998, 1997 and 1996 is shown in the tables below.
1) Business segment information is as follows:
Millions of yen
Audiovisual and
information- Eliminations
related Entertainment and Consolidated
business business Total unallocation total
1998:
Sales
External sales.................................................................................. ¥779,603 ¥136,703 ¥916,306 ¥ — ¥916,306
Intersegment sales .......................................................................... — 1,968 1,968 (1,968) —
Total sales ....................................................................................... 779,603 138,671 918,274 (1,968) 916,306
Operating expenses .......................................................................... 774,690 133,124 907,814 (1,541) 906,273
Operating income ............................................................................. ¥ 4,913 ¥ 5,547 ¥ 10,460 ¥ (427) ¥ 10,033
Identifiable assets.............................................................................. ¥431,647 ¥ 84,056 ¥515,703 ¥108,347 ¥624,050
Depreciation & amortization............................................................... 19,733 3,695 23,428 580 24,008
Capital expenditures.......................................................................... 33,637 2,829 36,466 185 36,651
1997:
Sales
External sales.................................................................................. ¥755,576 ¥134,797 ¥890,373 ¥ — ¥890,373
Intersegment sales .......................................................................... — 2,868 2,868 (2,868) —
Total sales ....................................................................................... 755,576 137,665 893,241 (2,868) 890,373
Operating expenses .......................................................................... 753,867 127,799 881,666 (2,816) 878,850
Operating income ............................................................................. ¥ 1,709 ¥ 9,866 ¥ 11,575 ¥ (52) ¥ 11,523
Identifiable assets.............................................................................. ¥377,693 ¥088,374 ¥466,067 ¥137,853 ¥603,920
Depreciation & amortization............................................................... 15,273 3,940 19,213 799 20,012
Capital expenditures.......................................................................... 17,622 5,126 22,748 804 23,552
1996:
Sales
External sales.................................................................................. ¥673,016 ¥133,535 ¥806,551 ¥ — ¥806,551
Intersegment sales .......................................................................... — 3,357 3,357 (3,357) —
Total sales ....................................................................................... 673,016 136,892 809,908 (3,357) 806,551
Operating expenses .......................................................................... 675,347 129,388 804,735 (3,357) 801,378
Operating income (loss)..................................................................... ¥ (2,331) ¥ 7,504 ¥ 5,173 ¥ — ¥ 5,173
Identifiable assets.............................................................................. ¥347,466 ¥ 77,858 ¥425,324 ¥136,330 ¥561,654
Depreciation & amortization............................................................... 12,218 3,798 16,016 1,050 17,066
Capital expenditures.......................................................................... 17,496 5,010 22,506 1,657 24,163
Thousands of U.S. dollars
Audiovisual and
information- Eliminations
related Entertainment and Consolidated
business business Total unallocation total
1998:
Sales
External sales.................................................................................. $5,906,083 $1,035,629 $6,941,712 $ — $6,941,712
Intersegment sales .......................................................................... — 14,909 14,909 (14,909) —
Total sales ....................................................................................... 5,906,083 1,050,538 6,956,621 (14,909) 6,941,712
Operating expenses .......................................................................... 5,868,864 1,008,515 6,877,379 (11,675) 6,865,704
Operating income.............................................................................. $ 37,219 $ 42,023 $ 79,242 $ (3,234) $ 76,008
Identifiable assets.............................................................................. $3,270,053 $ 636,788 $3,906,841 $820,810 $4,727,651
Depreciation & amortization............................................................... 149,492 27,993 177,485 4,394 181,879
Capital expenditures.......................................................................... 254,826 21,432 276,258 1,401 277,659