JVC 1998 Annual Report Download - page 17
Download and view the complete annual report
Please find page 17 of the 1998 JVC annual report below. You can navigate through the pages in the report by either clicking on the pages listed below, or by using the keyword search tool below to find specific information within the annual report.-
 1
1 -
2
-
3
-
4
-
5
-
6
-
 7
7 -
 8
8 -
 9
9 -
 10
10 -
 11
11 -
 12
12 -
 13
13 -
 14
14 -
 15
15 -
 16
16 -
 17
17 -
 18
18 -
 19
19 -
 20
20 -
 21
21 -
 22
22 -
 23
23 -
 24
24 -
 25
25 -
 26
26 -
 27
27 -
28
-
29
-
30
-
31
-
32
-
33
-
34
-
35
-
36
-
37
-
38
 |
 |

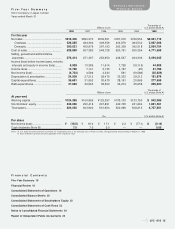
JVC 1998 15
Thousands of
Millions of yen U.S. dollars (Note A)
1998 1997 1996 1995 1994 1998
For the year
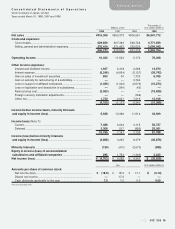
Net sales................................................... ¥916,306 ¥890,373 ¥806,551 ¥767,218 ¥726,550 $6,941,712
Overseas .............................................. 526,285 484,394 409,358 403,879 384,532 3,987,008
Domestic .............................................. 390,021 405,979 397,193 363,339 342,018 2,954,704
Cost of sales............................................. 629,859 607,383 548,728 520,751 535,354 4,771,659
Selling, general and administrative
expenses ................................................. 276,414 271,467 252,650 246,547 224,336 2,094,045
Income (loss) before income taxes, minority
interests and equity in income (loss)......... 5,928 10,386 11,514 7,728 (19,116) 44,909
Income taxes ............................................ 10,796 7,141 3,135 6,197 (20) 81,788
Net income (loss)...................................... (4,703) 4,586 4,343 591 (19,588) (35,629)
Depreciation & amortization ...................... 24,008 27,212 28,475 30,333 29,212 181,879
Capital expenditures ................................. 36,651 31,552 30,479 28,151 25,966 277,659
R&D expenditures..................................... 37,649 39,563 38,500 36,274 35,658 285,220
Thousands of
Millions of yen U.S. dollars (Note A)
At year-end
Working capital......................................... ¥124,395 ¥160,869 ¥123,357 ¥133,103 ¥133,750 $ 942,386
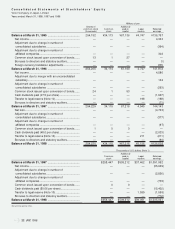
Stockholders’ equity ................................. 243,086 250,418 247,891 242,745 241,664 1,841,561
Total assets............................................... 624,050 603,920 561,654 520,699 508,213 4,727,651
Yen U.S. dollars (Note A)
Per share
Net income (loss)...................................... ¥ (18.5) ¥ 18.0 ¥ 17.1 ¥ 2.3 ¥ (77.1) $ (0.14)
Cash dividends (Note B) ........................... 7.0 7.0 5.0 — — 0.05
Notes: A. U.S. dollar amounts have been translated, for convenience only, at the exchange rate of ¥132 to U.S.$1, the approximate rate prevailing on March 31, 1998.
B. Cash dividends represent amounts applicable to the respective years.
Five-Year Summary
Victor Company of Japan, Limited
Years ended March 31
Financial Contents
Five-Year Summary 15
Financial Review 16
Consolidated Statements of Operations 19
Consolidated Balance Sheets 20
Consolidated Statements of Stockholders’ Equity 22
Consolidated Statements of Cash Flows 23
Notes to Consolidated Financial Statements 24
Report of Independent Public Accountants 30
Overseas Operations/
Financial Section