JVC 1998 Annual Report Download - page 2
Download and view the complete annual report
Please find page 2 of the 1998 JVC annual report below. You can navigate through the pages in the report by either clicking on the pages listed below, or by using the keyword search tool below to find specific information within the annual report.-
 1
1 -
 2
2 -
 3
3 -
 4
4 -
 5
5 -
 6
6 -
 7
7 -
 8
8 -
 9
9 -
 10
10 -
 11
11 -
 12
12 -
 13
13 -
14
-
15
-
16
-
17
-
18
-
19
-
20
-
21
-
22
-
23
-
24
-
25
-
26
-
27
-
28
-
29
-
30
-
31
-
32
-
33
-
34
-
35
-
36
-
37
-
38
 |
 |

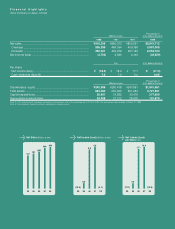
Financial Highlights
Victor Company of Japan, Limited
727 767 807
890 916
(77.1)
2.3
17.1 18.0
(18.5)
(19.6)
0.6
4.3 4.6
(4.7)
94
Net Income (Loss)
per Share (Yen)
Net Income (Loss) (Billions of yen)
Net Sales (Billions of yen)
95 96 97 98 94 95 96 97 98 94 95 96 97 98
Thousands of
Millions of yen U.S. dollars (Note A)
1998 1997 1996 1998
Net sales........................................................................................ ¥916,306 ¥890,373 ¥806,551 $6,941,712
Overseas ..................................................................................... 526,285 484,394 409,358 3,987,008
Domestic ..................................................................................... 390,021 405,979 397,193 2,954,704
Net income (loss)........................................................................... (4,703) 4,586 4,343 (35,629)
Yen U.S. dollars (Note A)
Per share:
Net income (loss)......................................................................... ¥ (18.5) ¥ 18.0 ¥ 17.1 $ (0.14)
Cash dividends (Note B).............................................................. 7.0 7.0 5.0 0.05
Thousands of
Millions of yen U.S. dollars (Note A)
Stockholders’ equity...................................................................... ¥243,086 ¥250,418 ¥247,891 $1,841,561
Total assets ................................................................................... 624,050 603,920 561,654 4,727,651
Capital expenditures...................................................................... 36,651 31,552 30,479 277,659
Depreciation & amortization........................................................... 24,008 27,212 28,475 181,879
Note: A. U.S. dollar amounts have been translated, for convenience only, at the exchange rate of ¥132 to US$1, the approximate rate prevailing on March 31, 1998.
Note: B. Cash dividends represent amounts applicable to respective years.