JVC 1998 Annual Report Download - page 20
Download and view the complete annual report
Please find page 20 of the 1998 JVC annual report below. You can navigate through the pages in the report by either clicking on the pages listed below, or by using the keyword search tool below to find specific information within the annual report.-
 1
1 -
2
-
3
-
4
-
5
-
6
-
7
-
8
-
9
-
 10
10 -
 11
11 -
 12
12 -
 13
13 -
 14
14 -
 15
15 -
 16
16 -
 17
17 -
 18
18 -
 19
19 -
 20
20 -
 21
21 -
 22
22 -
 23
23 -
 24
24 -
 25
25 -
 26
26 -
 27
27 -
 28
28 -
 29
29 -
 30
30 -
31
-
32
-
33
-
34
-
35
-
36
-
37
-
38
 |
 |

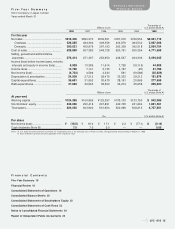
previous fiscal year. Net loss per share of common stock was
¥18.5 (US$0.14) compared with net income per share of common
stock of ¥18.0 in the previous fiscal year.
Cash dividends applicable to the year were maintained at ¥7.0
(US$0.05).
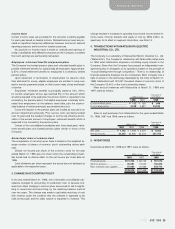
Cash Flow Analysis
Capital expenditures during the year increased to ¥36,651 million
(US$277.7 million), exceeding depreciation and amortization of
¥24,008 million (US$181.9 million). Capital expenditures were
focused on increasing digitization and multimedia functions in
Consumer Electronics and Professional Electronics through
strengthened product development and production capacity.
Investments were also made to promote the construction of an
optimal worldwide production network, enhanced by the establish-
ment of P.T. JVC Electronics Indonesia, to raise production capac-
ity in audiovisual equipment and in components and devices, and
to upgrade JVC’s global information and distribution networks.
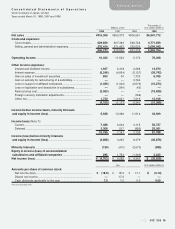
Net cash provided by operating activities was ¥22,099 million
(US$167.4 million) compared with ¥27,740 million in the previous
fiscal year. This includes net loss of ¥4,703 million (US$35.6 mil-
lion) and depreciation and amortization of ¥24,008 million
(US$181.9 million).
Net cash used in investing activities was ¥36,704 million
(US$278.1 million), compared with ¥39,167 million in the previous
term. Capital expenditures of ¥36,651 million (US$277.7 million)
made up the largest use of cash.
Net cash provided by financing activities was ¥389 million
(US$2.9 million) compared with ¥33,493 million in the previous
fiscal year. During the previous term, the Company issued bonds of
¥40,000 million for the promotion of “Victor Vision.” Capital
requirements during the term under review were met primarily
through cash flow and cash on hand.
As a result, cash at end of the year was ¥71,148 million
(US$539.0 million), a decrease of 16.1% from the previous fiscal
year.
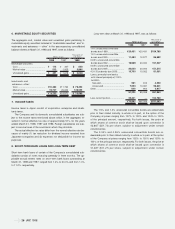
Financial Position
A number of events, including those mentioned previously, affected
JVC’s financial position.
Total assets increased 3.3% to ¥624,050 million (US$4,727.7
million).
Working capital fell 22.7% to ¥124,395 million (US$942.4
million). Total current assets rose 3.7% to ¥410,122 million
(US$3,107.0 million). As stated previously, cash decreased ¥13,649
million (US$103.4 million). Total current liabilities climbed 21.7% to
¥285,728 million (US$2,164.6 million). Consequently, the current
ratio declined to 1.44 from 1.69.
Interest-bearing debt advanced 7.3% to ¥161,209 million
(US$1,221.3 million). Bank loans rose 26.6% to ¥69,883 million
(US$529.4 million).
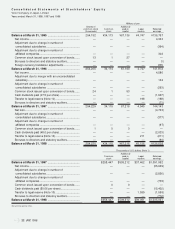
Stockholders’ equity decreased 2.9% to ¥243,086 million
(US$1,841.6 million). This was the result of lower retained earnings
following the net loss during the term. As a result, stockholders’
equity as a percentage of total assets was 39.0%, compared with
41.5% in the previous fiscal year. Stockholders’ equity per share
decreased 2.9% to ¥956.2 (US$7.24).
18 JVC 1998
Capital Expenditures Depreciation & Amortization
26.0
29.2 28.2 30.3 30.5 28.5
31.6
27.2
36.7
24.0
Capital Expenditures/Depreciation & Amortization
(Billions of yen)
94 95 96 97 98
508 521 562 604 624
242 243 248 250 243
Stockholders’ Equity/
Total Assets (Billions of yen)
Stockholders’ Equity
94 95 96 97 98