JP Morgan Chase 2015 Annual Report Download - page 6
Download and view the complete annual report
Please find page 6 of the 2015 JP Morgan Chase annual report below. You can navigate through the pages in the report by either clicking on the pages listed below, or by using the keyword search tool below to find specific information within the annual report.-
 1
1 -
 2
2 -
 3
3 -
 4
4 -
 5
5 -
 6
6 -
 7
7 -
 8
8 -
 9
9 -
 10
10 -
 11
11 -
 12
12 -
 13
13 -
 14
14 -
 15
15 -
 16
16 -
 17
17 -
18
-
19
-
20
-
21
-
22
-
23
-
24
-
25
-
26
-
27
-
28
-
29
-
30
-
31
-
32
-
33
-
34
-
35
-
36
-
37
-
38
-
39
-
40
-
41
-
42
-
43
-
44
-
45
-
46
-
47
-
48
-
49
-
50
-
51
-
52
-
53
-
54
-
55
-
56
-
57
-
58
-
59
-
60
-
61
-
62
-
63
-
64
-
65
-
66
-
67
-
68
-
69
-
70
-
71
-
72
-
73
-
74
-
75
-
76
-
77
-
78
-
79
-
80
-
81
-
82
-
83
-
84
-
85
-
86
-
87
-
88
-
89
-
90
-
91
-
92
-
93
-
94
-
95
-
96
-
97
-
98
-
99
-
100
-
101
-
102
-
103
-
104
-
105
-
106
-
107
-
108
-
109
-
110
-
111
-
112
-
113
-
114
-
115
-
116
-
117
-
118
-
119
-
120
-
121
-
122
-
123
-
124
-
125
-
126
-
127
-
128
-
129
-
130
-
131
-
132
-
133
-
134
-
135
-
136
-
137
-
138
-
139
-
140
-
141
-
142
-
143
-
144
-
145
-
146
-
147
-
148
-
149
-
150
-
151
-
152
-
153
-
154
-
155
-
156
-
157
-
158
-
159
-
160
-
161
-
162
-
163
-
164
-
165
-
166
-
167
-
168
-
169
-
170
-
171
-
172
-
173
-
174
-
175
-
176
-
177
-
178
-
179
-
180
-
181
-
182
-
183
-
184
-
185
-
186
-
187
-
188
-
189
-
190
-
191
-
192
-
193
-
194
-
195
-
196
-
197
-
198
-
199
-
200
-
201
-
202
-
203
-
204
-
205
-
206
-
207
-
208
-
209
-
210
-
211
-
212
-
213
-
214
-
215
-
216
-
217
-
218
-
219
-
220
-
221
-
222
-
223
-
224
-
225
-
226
-
227
-
228
-
229
-
230
-
231
-
232
-
233
-
234
-
235
-
236
-
237
-
238
-
239
-
240
-
241
-
242
-
243
-
244
-
245
-
246
-
247
-
248
-
249
-
250
-
251
-
252
-
253
-
254
-
255
-
256
-
257
-
258
-
259
-
260
-
261
-
262
-
263
-
264
-
265
-
266
-
267
-
268
-
269
-
270
-
271
-
272
-
273
-
274
-
275
-
276
-
277
-
278
-
279
-
280
-
281
-
282
-
283
-
284
-
285
-
286
-
287
-
288
-
289
-
290
-
291
-
292
-
293
-
294
-
295
-
296
-
297
-
298
-
299
-
300
-
301
-
302
-
303
-
304
-
305
-
306
-
307
-
308
-
309
-
310
-
311
-
312
-
313
-
314
-
315
-
316
-
317
-
318
-
319
-
320
-
321
-
322
-
323
-
324
-
325
-
326
-
327
-
328
-
329
-
330
-
331
-
332
 |
 |

44
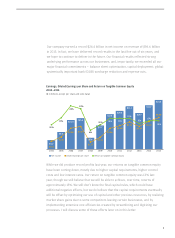
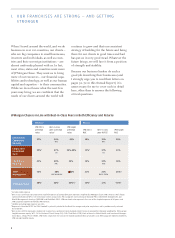
We continued to deliver for our shareholders in 2015. The table above shows the
growth in tangible book value per share, which we believe is a conservative measure
of value. You can see that our tangible book value per share has grown far more than
that of the Standard & Poor’s 500 Index (S&P 500) in both time periods. For Bank
One shareholders since March 27, 2000, the stock has performed far better than most
financial companies and the S&P 500. We are not proud of the fact that our stock
performance has only equaled the S&P 500 since the JPMorgan Chase & Co. merger
with Bank One on July 1, 2004 and essentially over the last five to 10 years. On a
relative basis, though, JPMorgan Chase stock has far outperformed the S&P Financials
Index and, in fact, has been one of the best performers of all banks during this dicult
period. The details are shown on the table on the following page.
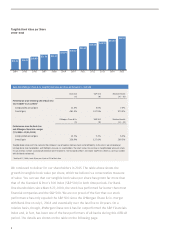
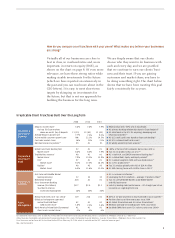
201520142013201220112010200920082007200620052004
$15.35 $16.45 $18.88
$21.96 $22.52
$27.09
$30.12
$33.62
$38.68 $40.72
$44.60
$48.13
2004–2015
Tangible Book Value per Share
2004—2015
Bank One/JPMorgan Chase & Co. tangible book value per share performance vs. S&P 500
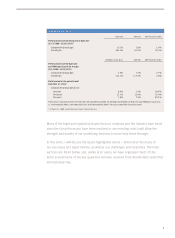
Bank One
(A)
S&P 500
(B)
Relative Results
(A) — (B)
Performance since becoming CEO of Bank One
(3/27/2000—12/31/2015)1
Compounded annual gain 12.5% 5.0% 7.5%
Overall gain 481.4% 107.9% 373.5%
JPMorgan Chase & Co.
(A)
S&P 500
(B)
Relative Results
(A) — (B)
Performance since the Bank One
and JPMorgan Chase & Co. merger
(7/1/2004—12/31/2015)
Compounded annual gain 13.7% 7.4% 6.3%
Overall gain 336.9% 127.6% 209.3%
Tangible book value over time captures the company’s use of capital, balance sheet and profitability. In this chart, we are looking at
heritage Bank One shareholders and JPMorgan Chase & Co. shareholders. The chart shows the increase in tangible book value per share;
it is an aftertax number assuming all dividends were retained vs. the Standard & Poor’s 500 Index (S&P 500), which is a pre-tax number
with dividends reinvested.
1 On March 27, 2000, Jamie Dimon was hired as CEO of Bank One.