JP Morgan Chase 2015 Annual Report Download - page 11
Download and view the complete annual report
Please find page 11 of the 2015 JP Morgan Chase annual report below. You can navigate through the pages in the report by either clicking on the pages listed below, or by using the keyword search tool below to find specific information within the annual report.-
 1
1 -
 2
2 -
 3
3 -
 4
4 -
 5
5 -
 6
6 -
 7
7 -
 8
8 -
 9
9 -
 10
10 -
 11
11 -
 12
12 -
 13
13 -
 14
14 -
 15
15 -
 16
16 -
 17
17 -
 18
18 -
 19
19 -
 20
20 -
 21
21 -
 22
22 -
23
-
24
-
25
-
26
-
27
-
28
-
29
-
30
-
31
-
32
-
33
-
34
-
35
-
36
-
37
-
38
-
39
-
40
-
41
-
42
-
43
-
44
-
45
-
46
-
47
-
48
-
49
-
50
-
51
-
52
-
53
-
54
-
55
-
56
-
57
-
58
-
59
-
60
-
61
-
62
-
63
-
64
-
65
-
66
-
67
-
68
-
69
-
70
-
71
-
72
-
73
-
74
-
75
-
76
-
77
-
78
-
79
-
80
-
81
-
82
-
83
-
84
-
85
-
86
-
87
-
88
-
89
-
90
-
91
-
92
-
93
-
94
-
95
-
96
-
97
-
98
-
99
-
100
-
101
-
102
-
103
-
104
-
105
-
106
-
107
-
108
-
109
-
110
-
111
-
112
-
113
-
114
-
115
-
116
-
117
-
118
-
119
-
120
-
121
-
122
-
123
-
124
-
125
-
126
-
127
-
128
-
129
-
130
-
131
-
132
-
133
-
134
-
135
-
136
-
137
-
138
-
139
-
140
-
141
-
142
-
143
-
144
-
145
-
146
-
147
-
148
-
149
-
150
-
151
-
152
-
153
-
154
-
155
-
156
-
157
-
158
-
159
-
160
-
161
-
162
-
163
-
164
-
165
-
166
-
167
-
168
-
169
-
170
-
171
-
172
-
173
-
174
-
175
-
176
-
177
-
178
-
179
-
180
-
181
-
182
-
183
-
184
-
185
-
186
-
187
-
188
-
189
-
190
-
191
-
192
-
193
-
194
-
195
-
196
-
197
-
198
-
199
-
200
-
201
-
202
-
203
-
204
-
205
-
206
-
207
-
208
-
209
-
210
-
211
-
212
-
213
-
214
-
215
-
216
-
217
-
218
-
219
-
220
-
221
-
222
-
223
-
224
-
225
-
226
-
227
-
228
-
229
-
230
-
231
-
232
-
233
-
234
-
235
-
236
-
237
-
238
-
239
-
240
-
241
-
242
-
243
-
244
-
245
-
246
-
247
-
248
-
249
-
250
-
251
-
252
-
253
-
254
-
255
-
256
-
257
-
258
-
259
-
260
-
261
-
262
-
263
-
264
-
265
-
266
-
267
-
268
-
269
-
270
-
271
-
272
-
273
-
274
-
275
-
276
-
277
-
278
-
279
-
280
-
281
-
282
-
283
-
284
-
285
-
286
-
287
-
288
-
289
-
290
-
291
-
292
-
293
-
294
-
295
-
296
-
297
-
298
-
299
-
300
-
301
-
302
-
303
-
304
-
305
-
306
-
307
-
308
-
309
-
310
-
311
-
312
-
313
-
314
-
315
-
316
-
317
-
318
-
319
-
320
-
321
-
322
-
323
-
324
-
325
-
326
-
327
-
328
-
329
-
330
-
331
-
332
 |
 |

99
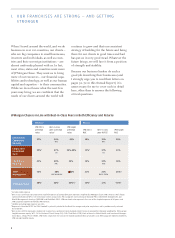
Virtually all of our businesses are close to
best in class, in overhead ratios and, more
important, in return on equity (ROE), as
shown on the chart on page 8. Of even more
relevance, we have these strong ratios while
making sizable investments for the future
(which we have reported on extensively in
the past and you can read more about in the
CEO letters). It is easy to meet short-term
targets by skimping on investments for
the future, but that is not our approach for
building the business for the long term.
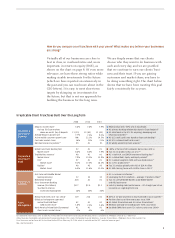
How do you compare your franchises with your peers? What makes you believe your businesses
are strong?
We are deeply aware that our clients
choose who they want to do business with
each and every day, and we are gratified
that we continue to earn our clients’ busi-
ness and their trust. If you are gaining
customers and market share, you have to
be doing something right. The chart below
shows that we have been meeting this goal
fairly consistently for 10 years.
Irreplicable Client Franchises Built Over the Long Term
2006 2014 2015
Consumer &
Community
Banking
Deposits market share1
# of top 50 Chase markets
where we are #1 (top 3) deposits
Average deposits growth rate
Active mobile customers growth rate
Card sales market share2
Merchant processing volume3,4
3.6%
11 (25)
7.7%
NM
16%
#3
7.6%
13 (40)
7.4%
22.1%
21%
#1
7.9%
12 (40)
9.0%
19.5%
21%
#1
Relationships with ~50% of U.S. households
#1 primary banking relationship share in Chase footprint11
#1 retail bank in the U.S. for acquiring, developing and
retaining customers12
#1 U.S. credit card issuer based on loans outstanding13
#1 U.S. co-brand credit card issuer14
#1 wholly-owned merchant acquirer15
Corporate &
Investment
Bank
Global Investment Banking fees5
Market share5
Total Markets revenue6
Market share6
FICC6
Market share6
Equities6
Market share6
#2
8.6%
#8
7.9%
#7
9.1%
#8
6.0%
#1
8.0%
#1
15.5%
#1
17.5%
#3
11.6%
#1
7.9%
#1
15.9%
#1
18.3%
#3
12.0%
>80% of Fortune 500 companies do business with us
Top 3 in 16 product areas out of 1716
#1 in both N.A. and EMEA Investment Banking fees17
#1 in Global Debt, Equity and Equity-related17
#1 in Global Long-Term Debt and Loan Syndications17
#1 in FICC productivity18
Top 3 Custodian globally with AUC of $19.9 trillion
#1 USD clearing house with 18.9% share in 201519
Commercial
Banking
# of states with Middle Market
banking presence
Multifamily lending7
Gross Investment Banking
revenue ($ in billions)
% of North America
Investment Banking fees
22
#28
$0.7
16%
30
#1
$2.0
35%
32
#1
$2.2
36%
#1 in customer satisfaction20
Leveraging the firm’s platform — average ~9 products/client21
Top 3 in overall Middle Market, large Middle Market
and ABL bookrunner
Industry-leading credit performance — 4th straight year of net
recoveries or single digit NCO rate
Asset
Management
Mutual funds with a 4/5 star rating8
Global active long-term open-end
mutual fund AUM flows9
AUM market share9
North America Private Bank (Euromoney)
Client assets market share10
119
#2
1.8%
#1
~3%
226
#1
2.5%
#1
~4%
231
#2
2.6%
#1
~4%
84% of 10-year long-term mutual fund AUM in top 2 quartiles22
Positive client asset flows every year since 2004
#3 Global Private Bank and #1 LatAm Private Bank23
Revenue and long-term AUM growth ~80% since 2006
Doubled GWM client assets (2x industry rate) since 200610
For footnoted information, refer to slide 42 in the 2016 Firm Overview Investor Day presentation, which is available on JPMorgan Chase & Co.’s website at
(http://investor.shareholder.com/jpmorganchase/presentations.cfm), under the heading Investor Relations, Investor Presentations, JPMorgan Chase 2016 Investor Day,
Firm Overview, and on Form 8-K as furnished to the SEC on February 24, 2016, which is available on the SEC’s website (www.sec.gov).
NM = Not meaningful