JP Morgan Chase 2015 Annual Report Download - page 15
Download and view the complete annual report
Please find page 15 of the 2015 JP Morgan Chase annual report below. You can navigate through the pages in the report by either clicking on the pages listed below, or by using the keyword search tool below to find specific information within the annual report.-
 1
1 -
2
-
3
-
4
-
 5
5 -
 6
6 -
 7
7 -
 8
8 -
 9
9 -
 10
10 -
 11
11 -
 12
12 -
 13
13 -
 14
14 -
 15
15 -
 16
16 -
 17
17 -
 18
18 -
 19
19 -
 20
20 -
 21
21 -
 22
22 -
 23
23 -
 24
24 -
 25
25 -
26
-
27
-
28
-
29
-
30
-
31
-
32
-
33
-
34
-
35
-
36
-
37
-
38
-
39
-
40
-
41
-
42
-
43
-
44
-
45
-
46
-
47
-
48
-
49
-
50
-
51
-
52
-
53
-
54
-
55
-
56
-
57
-
58
-
59
-
60
-
61
-
62
-
63
-
64
-
65
-
66
-
67
-
68
-
69
-
70
-
71
-
72
-
73
-
74
-
75
-
76
-
77
-
78
-
79
-
80
-
81
-
82
-
83
-
84
-
85
-
86
-
87
-
88
-
89
-
90
-
91
-
92
-
93
-
94
-
95
-
96
-
97
-
98
-
99
-
100
-
101
-
102
-
103
-
104
-
105
-
106
-
107
-
108
-
109
-
110
-
111
-
112
-
113
-
114
-
115
-
116
-
117
-
118
-
119
-
120
-
121
-
122
-
123
-
124
-
125
-
126
-
127
-
128
-
129
-
130
-
131
-
132
-
133
-
134
-
135
-
136
-
137
-
138
-
139
-
140
-
141
-
142
-
143
-
144
-
145
-
146
-
147
-
148
-
149
-
150
-
151
-
152
-
153
-
154
-
155
-
156
-
157
-
158
-
159
-
160
-
161
-
162
-
163
-
164
-
165
-
166
-
167
-
168
-
169
-
170
-
171
-
172
-
173
-
174
-
175
-
176
-
177
-
178
-
179
-
180
-
181
-
182
-
183
-
184
-
185
-
186
-
187
-
188
-
189
-
190
-
191
-
192
-
193
-
194
-
195
-
196
-
197
-
198
-
199
-
200
-
201
-
202
-
203
-
204
-
205
-
206
-
207
-
208
-
209
-
210
-
211
-
212
-
213
-
214
-
215
-
216
-
217
-
218
-
219
-
220
-
221
-
222
-
223
-
224
-
225
-
226
-
227
-
228
-
229
-
230
-
231
-
232
-
233
-
234
-
235
-
236
-
237
-
238
-
239
-
240
-
241
-
242
-
243
-
244
-
245
-
246
-
247
-
248
-
249
-
250
-
251
-
252
-
253
-
254
-
255
-
256
-
257
-
258
-
259
-
260
-
261
-
262
-
263
-
264
-
265
-
266
-
267
-
268
-
269
-
270
-
271
-
272
-
273
-
274
-
275
-
276
-
277
-
278
-
279
-
280
-
281
-
282
-
283
-
284
-
285
-
286
-
287
-
288
-
289
-
290
-
291
-
292
-
293
-
294
-
295
-
296
-
297
-
298
-
299
-
300
-
301
-
302
-
303
-
304
-
305
-
306
-
307
-
308
-
309
-
310
-
311
-
312
-
313
-
314
-
315
-
316
-
317
-
318
-
319
-
320
-
321
-
322
-
323
-
324
-
325
-
326
-
327
-
328
-
329
-
330
-
331
-
332
 |
 |

1313
tive credit losses were for all banks during
the Great Recession (they were 5.6%), and
our credit book today is materially better
than what we had at that time. The 2015
CCAR losses were even with the actual losses
for banks during the worst two years of the
Great Depression in the 1930s (6.4%).
The stress test is extremely severe on trading and
counterparty risk.
Our 2015 CCAR trading and counterparty
losses were $24 billion. We have two compar-
isons that should give comfort that our losses
would never be this large.
First, recall what actually happened to us in
2008. In the worst quarter of 2008, we lost
$1.7 billion; for the entire year, we made $6.3
billion in trading revenue in the Investment
Bank, which included some modest losses
on the Lehman default (one of our largest
counterparties). The trading books are much
more conservative today than they were in
2008, and at that time, we were still paying
a considerable cost for assimilating and
de-risking Bear Stearns.
Second, we run hundreds of stress tests
of our own each week, across our global
trading operations, to ensure our ability
to withstand and survive many bad and
extreme scenarios. These scenarios include
events such as what happened in 2008, other
historically damaging events and also new
situations that might occur. We manage
our company so that even under the worst
market stress test conditions, we would
almost never bear a loss of more than $5
billion (remember, we earn approximately
$10 billion pre-tax, pre-provision each
quarter). We recognize that on rare occa-
sions, we could experience a negative signifi-
cant event that could lead to our having a
poor quarter. But we will be vigilant and will
never take such a high degree of risk that it
jeopardizes the health of our company and
our ability to continue to serve our clients.
This is a bedrock principle. Later in this
letter, I will also describe how we think about
idiosyncratic geopolitical risk.
And the capital we have to bear losses is
enormous.
We have an extraordinary amount of capital
to sustain us in the event of losses. It is
instructive to compare assumed extreme
losses against how much capital we have for
this purpose.
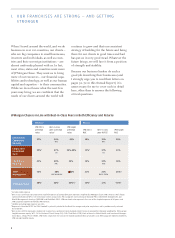
You can see in the table below that JPMorgan
Chase alone has enough loss absorbing
resources to bear all the losses, assumed by
CCAR, of the 31 largest banks in the United
States. Because of regulations and higher
capital, large banks in the United States are
far stronger. And even if any one bank might
fail, in my opinion, there is virtually no
chance of a domino eect. Our shareholders
should understand that while large banks do
significant business with each other, they do
not directly extend much credit to one other.
And when they trade derivatives, they mark-
to-market and post collateral to each other
every day.
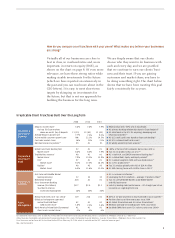
Resilience of JPMorgan Chase through multiple layers of protection
($ in billions)
Total loss absorbing resources
December 31, 2015:
JPMorgan Chase quarterly estimated
pre-tax, pre-provision earnings ~$ 10
Eligible long-term debt $ 125
Preferred equity 26 CCAR industry losses2
CET1 173 JPMorgan Chase losses $ 55
Total reserves1 25 Losses of 30 other participating banks 167
Total resources ˜$ 350 Total CCAR losses $ 222
1 Includes credit, legal, tax and valuation reserves.
2 As estimated for the nine quarters ending December 31, 2016, by the Federal Reserve in the 2015 CCAR severely adverse scenario.
Note: Numbers may not sum due to rounding.