JP Morgan Chase 2015 Annual Report Download - page 5
Download and view the complete annual report
Please find page 5 of the 2015 JP Morgan Chase annual report below. You can navigate through the pages in the report by either clicking on the pages listed below, or by using the keyword search tool below to find specific information within the annual report.-
 1
1 -
 2
2 -
 3
3 -
 4
4 -
 5
5 -
 6
6 -
 7
7 -
 8
8 -
 9
9 -
 10
10 -
 11
11 -
 12
12 -
 13
13 -
 14
14 -
 15
15 -
 16
16 -
17
-
18
-
19
-
20
-
21
-
22
-
23
-
24
-
25
-
26
-
27
-
28
-
29
-
30
-
31
-
32
-
33
-
34
-
35
-
36
-
37
-
38
-
39
-
40
-
41
-
42
-
43
-
44
-
45
-
46
-
47
-
48
-
49
-
50
-
51
-
52
-
53
-
54
-
55
-
56
-
57
-
58
-
59
-
60
-
61
-
62
-
63
-
64
-
65
-
66
-
67
-
68
-
69
-
70
-
71
-
72
-
73
-
74
-
75
-
76
-
77
-
78
-
79
-
80
-
81
-
82
-
83
-
84
-
85
-
86
-
87
-
88
-
89
-
90
-
91
-
92
-
93
-
94
-
95
-
96
-
97
-
98
-
99
-
100
-
101
-
102
-
103
-
104
-
105
-
106
-
107
-
108
-
109
-
110
-
111
-
112
-
113
-
114
-
115
-
116
-
117
-
118
-
119
-
120
-
121
-
122
-
123
-
124
-
125
-
126
-
127
-
128
-
129
-
130
-
131
-
132
-
133
-
134
-
135
-
136
-
137
-
138
-
139
-
140
-
141
-
142
-
143
-
144
-
145
-
146
-
147
-
148
-
149
-
150
-
151
-
152
-
153
-
154
-
155
-
156
-
157
-
158
-
159
-
160
-
161
-
162
-
163
-
164
-
165
-
166
-
167
-
168
-
169
-
170
-
171
-
172
-
173
-
174
-
175
-
176
-
177
-
178
-
179
-
180
-
181
-
182
-
183
-
184
-
185
-
186
-
187
-
188
-
189
-
190
-
191
-
192
-
193
-
194
-
195
-
196
-
197
-
198
-
199
-
200
-
201
-
202
-
203
-
204
-
205
-
206
-
207
-
208
-
209
-
210
-
211
-
212
-
213
-
214
-
215
-
216
-
217
-
218
-
219
-
220
-
221
-
222
-
223
-
224
-
225
-
226
-
227
-
228
-
229
-
230
-
231
-
232
-
233
-
234
-
235
-
236
-
237
-
238
-
239
-
240
-
241
-
242
-
243
-
244
-
245
-
246
-
247
-
248
-
249
-
250
-
251
-
252
-
253
-
254
-
255
-
256
-
257
-
258
-
259
-
260
-
261
-
262
-
263
-
264
-
265
-
266
-
267
-
268
-
269
-
270
-
271
-
272
-
273
-
274
-
275
-
276
-
277
-
278
-
279
-
280
-
281
-
282
-
283
-
284
-
285
-
286
-
287
-
288
-
289
-
290
-
291
-
292
-
293
-
294
-
295
-
296
-
297
-
298
-
299
-
300
-
301
-
302
-
303
-
304
-
305
-
306
-
307
-
308
-
309
-
310
-
311
-
312
-
313
-
314
-
315
-
316
-
317
-
318
-
319
-
320
-
321
-
322
-
323
-
324
-
325
-
326
-
327
-
328
-
329
-
330
-
331
-
332
 |
 |

33
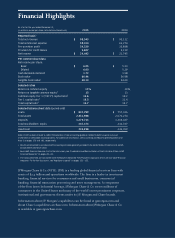
Our company earned a record $24.4 billion in net income on revenue of $96.6 billion
in 2015. In fact, we have delivered record results in the last five out of six years, and
we hope to continue to deliver in the future. Our financial results reflected strong
underlying performance across our businesses, and, importantly, we exceeded all our
major financial commitments — balance sheet optimization, capital deployment, global
systemically important bank (GSIB) surcharge reduction and expense cuts.
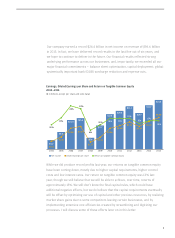
Earnings, Diluted Earnings per Share and Return on Tangible Common Equity
2004—2015
($ in billions, except per share and ratio data)
While we did produce record profits last year, our returns on tangible common equity
have been coming down, mostly due to higher capital requirements, higher control
costs and low interest rates. Our return on tangible common equity was 13% last
year, though we still believe that we will be able to achieve, over time, returns of
approximately 15%. We still don’t know the final capital rules, which could have
additional negative eects, but we do believe that the capital requirements eventually
will be oset by optimizing our use of capital and other precious resources, by realizing
market share gains due to some competitors leaving certain businesses, and by
implementing extensive cost eciencies created by streamlining and digitizing our
processes. I will discuss some of these eorts later on in this letter.
2014 20152013201220112010200920082007200620052004
$4.5
$1.52
$8.5
$2.35
$14.4
$4.00
$15.4
$4.33
$5.6
$1.35
$11.7
$2.26
$17.4
$3.96
$19.0
$4.48
$21.3
$5.19
$17.9
$4.34
$21.7
$5.29
$24.4
$6.00
Net income Diluted earnings per share Return on tangible common equity
10%
15%
24%
22%
6%
10% 15% 15%
15%
11%
13%
13%