JP Morgan Chase 2015 Annual Report Download - page 2
Download and view the complete annual report
Please find page 2 of the 2015 JP Morgan Chase annual report below. You can navigate through the pages in the report by either clicking on the pages listed below, or by using the keyword search tool below to find specific information within the annual report.-
 1
1 -
 2
2 -
 3
3 -
 4
4 -
 5
5 -
 6
6 -
 7
7 -
 8
8 -
 9
9 -
 10
10 -
 11
11 -
 12
12 -
 13
13 -
14
-
15
-
16
-
17
-
18
-
19
-
20
-
21
-
22
-
23
-
24
-
25
-
26
-
27
-
28
-
29
-
30
-
31
-
32
-
33
-
34
-
35
-
36
-
37
-
38
-
39
-
40
-
41
-
42
-
43
-
44
-
45
-
46
-
47
-
48
-
49
-
50
-
51
-
52
-
53
-
54
-
55
-
56
-
57
-
58
-
59
-
60
-
61
-
62
-
63
-
64
-
65
-
66
-
67
-
68
-
69
-
70
-
71
-
72
-
73
-
74
-
75
-
76
-
77
-
78
-
79
-
80
-
81
-
82
-
83
-
84
-
85
-
86
-
87
-
88
-
89
-
90
-
91
-
92
-
93
-
94
-
95
-
96
-
97
-
98
-
99
-
100
-
101
-
102
-
103
-
104
-
105
-
106
-
107
-
108
-
109
-
110
-
111
-
112
-
113
-
114
-
115
-
116
-
117
-
118
-
119
-
120
-
121
-
122
-
123
-
124
-
125
-
126
-
127
-
128
-
129
-
130
-
131
-
132
-
133
-
134
-
135
-
136
-
137
-
138
-
139
-
140
-
141
-
142
-
143
-
144
-
145
-
146
-
147
-
148
-
149
-
150
-
151
-
152
-
153
-
154
-
155
-
156
-
157
-
158
-
159
-
160
-
161
-
162
-
163
-
164
-
165
-
166
-
167
-
168
-
169
-
170
-
171
-
172
-
173
-
174
-
175
-
176
-
177
-
178
-
179
-
180
-
181
-
182
-
183
-
184
-
185
-
186
-
187
-
188
-
189
-
190
-
191
-
192
-
193
-
194
-
195
-
196
-
197
-
198
-
199
-
200
-
201
-
202
-
203
-
204
-
205
-
206
-
207
-
208
-
209
-
210
-
211
-
212
-
213
-
214
-
215
-
216
-
217
-
218
-
219
-
220
-
221
-
222
-
223
-
224
-
225
-
226
-
227
-
228
-
229
-
230
-
231
-
232
-
233
-
234
-
235
-
236
-
237
-
238
-
239
-
240
-
241
-
242
-
243
-
244
-
245
-
246
-
247
-
248
-
249
-
250
-
251
-
252
-
253
-
254
-
255
-
256
-
257
-
258
-
259
-
260
-
261
-
262
-
263
-
264
-
265
-
266
-
267
-
268
-
269
-
270
-
271
-
272
-
273
-
274
-
275
-
276
-
277
-
278
-
279
-
280
-
281
-
282
-
283
-
284
-
285
-
286
-
287
-
288
-
289
-
290
-
291
-
292
-
293
-
294
-
295
-
296
-
297
-
298
-
299
-
300
-
301
-
302
-
303
-
304
-
305
-
306
-
307
-
308
-
309
-
310
-
311
-
312
-
313
-
314
-
315
-
316
-
317
-
318
-
319
-
320
-
321
-
322
-
323
-
324
-
325
-
326
-
327
-
328
-
329
-
330
-
331
-
332
 |
 |

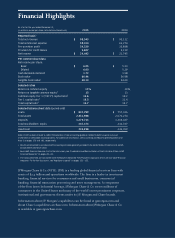
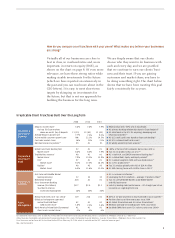
Financial Highlights
As of or for the year ended December 31,
(in millions, except per share, ratio data and headcount) 2015 2014
Reported basis1
Total net revenue $ 93,543 $ 95,112
Total noninterest expense 59,014 61,274
Pre-provision profit 34,529 33,838
Provision for credit losses 3,827 3,139
Net income $ 24,442 $ 21,745
Per common share data
Net income per share:
Basic $ 6.05 $ 5.33
Diluted 6.00 5.29
Cash dividends declared 1.72 1.58
Book value 60.46 56.98
Tangible book value2 48.13 44.60
Selected ratios
Return on common equity 11% 10%
Return on tangible common equity2 13 13
Common equity Tier 1 (“CET1”) capital ratio3 11.6 10.2
Tier 1 capital ratio3 13.3 11.4
Total capital ratio3 14.7 12.7
Selected balance sheet data (period-end)
Loans $ 837,299 $ 757,336
Total assets 2,351,698 2,572,274
Deposits 1,279,715 1,363,427
Total stockholders’ equity 247,573 231,727
Headcount 234,598 241,359
Note: 2014 has been revised to reflect the adoption of new accounting guidance related to debt issuance costs and
investments in aordable housing projects. For additional information, see Accounting and Reporting Developments and
Note 1 on pages 170 and 183, respectively.
1 Results are presented in accordance with accounting principles generally accepted in the United States of America (U.S. GAAP),
except where otherwise noted.
2 Non-GAAP financial measure. For further discussion, see “Explanation and Reconciliation of the Firm’s Use Of Non-GAAP
Financial Measures” on pages 80—82.
3 The ratios presented are calculated under the Basel III Advanced Fully Phased-In Approach, which are non-GAAP financial
measures. For further discussion, see “Regulatory capital” on pages 151—155.
Financial Highlights
JPMorgan Chase & Co. (NYSE: JPM) is a leading global financial services firm with
assets of $2.4 trillion and operations worldwide. The firm is a leader in investment
banking, financial services for consumers and small businesses, commercial
banking, financial transaction processing and asset management. A component
of the Dow Jones Industrial Average, JPMorgan Chase & Co. serves millions of
consumers in the United States and many of the world’s most prominent corporate,
institutional and government clients under its J.P. Morgan and Chase brands.
Information about J.P. Morgan’s capabilities can be found at jpmorgan.com and
about Chase’s capabilities at chase.com. Information about JPMorgan Chase & Co.
is available at jpmorganchase.com.