JP Morgan Chase 2015 Annual Report Download - page 10
Download and view the complete annual report
Please find page 10 of the 2015 JP Morgan Chase annual report below. You can navigate through the pages in the report by either clicking on the pages listed below, or by using the keyword search tool below to find specific information within the annual report.-
 1
1 -
 2
2 -
 3
3 -
 4
4 -
 5
5 -
 6
6 -
 7
7 -
 8
8 -
 9
9 -
 10
10 -
 11
11 -
 12
12 -
 13
13 -
 14
14 -
 15
15 -
 16
16 -
 17
17 -
 18
18 -
 19
19 -
 20
20 -
 21
21 -
22
-
23
-
24
-
25
-
26
-
27
-
28
-
29
-
30
-
31
-
32
-
33
-
34
-
35
-
36
-
37
-
38
-
39
-
40
-
41
-
42
-
43
-
44
-
45
-
46
-
47
-
48
-
49
-
50
-
51
-
52
-
53
-
54
-
55
-
56
-
57
-
58
-
59
-
60
-
61
-
62
-
63
-
64
-
65
-
66
-
67
-
68
-
69
-
70
-
71
-
72
-
73
-
74
-
75
-
76
-
77
-
78
-
79
-
80
-
81
-
82
-
83
-
84
-
85
-
86
-
87
-
88
-
89
-
90
-
91
-
92
-
93
-
94
-
95
-
96
-
97
-
98
-
99
-
100
-
101
-
102
-
103
-
104
-
105
-
106
-
107
-
108
-
109
-
110
-
111
-
112
-
113
-
114
-
115
-
116
-
117
-
118
-
119
-
120
-
121
-
122
-
123
-
124
-
125
-
126
-
127
-
128
-
129
-
130
-
131
-
132
-
133
-
134
-
135
-
136
-
137
-
138
-
139
-
140
-
141
-
142
-
143
-
144
-
145
-
146
-
147
-
148
-
149
-
150
-
151
-
152
-
153
-
154
-
155
-
156
-
157
-
158
-
159
-
160
-
161
-
162
-
163
-
164
-
165
-
166
-
167
-
168
-
169
-
170
-
171
-
172
-
173
-
174
-
175
-
176
-
177
-
178
-
179
-
180
-
181
-
182
-
183
-
184
-
185
-
186
-
187
-
188
-
189
-
190
-
191
-
192
-
193
-
194
-
195
-
196
-
197
-
198
-
199
-
200
-
201
-
202
-
203
-
204
-
205
-
206
-
207
-
208
-
209
-
210
-
211
-
212
-
213
-
214
-
215
-
216
-
217
-
218
-
219
-
220
-
221
-
222
-
223
-
224
-
225
-
226
-
227
-
228
-
229
-
230
-
231
-
232
-
233
-
234
-
235
-
236
-
237
-
238
-
239
-
240
-
241
-
242
-
243
-
244
-
245
-
246
-
247
-
248
-
249
-
250
-
251
-
252
-
253
-
254
-
255
-
256
-
257
-
258
-
259
-
260
-
261
-
262
-
263
-
264
-
265
-
266
-
267
-
268
-
269
-
270
-
271
-
272
-
273
-
274
-
275
-
276
-
277
-
278
-
279
-
280
-
281
-
282
-
283
-
284
-
285
-
286
-
287
-
288
-
289
-
290
-
291
-
292
-
293
-
294
-
295
-
296
-
297
-
298
-
299
-
300
-
301
-
302
-
303
-
304
-
305
-
306
-
307
-
308
-
309
-
310
-
311
-
312
-
313
-
314
-
315
-
316
-
317
-
318
-
319
-
320
-
321
-
322
-
323
-
324
-
325
-
326
-
327
-
328
-
329
-
330
-
331
-
332
 |
 |

88
When I travel around the world, and we do
business in over 100 countries, our clients –
who are big companies to small businesses,
investors and individuals, as well as coun-
tries and their sovereign institutions – are
almost uniformly pleased with us. In fact,
most cities, states and countries want more
of JPMorgan Chase. They want us to bring
more of our resources – our financial capa-
bilities and technology, as well as our human
capital and expertise – to their communities.
While we do not know what the next few
years may bring, we are confident that the
needs of our clients around the world will
continue to grow and that our consistent
strategy of building for the future and being
there for our clients in good times and bad
has put us in very good stead. Whatever the
future brings, we will face it from a position
of strength and stability.
Because our business leaders do such a
good job describing their businesses (and
I strongly urge you to read their letters on
pages 52–72 in this Annual Report), it is
unnecessary for me to cover each in detail
here, other than to answer the following
critical questions.
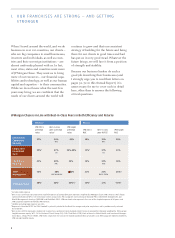
I. OURFRANCHISESARESTRONG—ANDGETTING
STRONGER
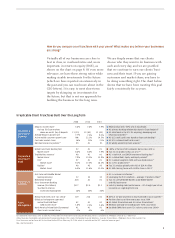
Eciency Returns
JPM 2015
overhead
ratios
Best-in-class
peer overhead
ratios2
JPM target
overhead
ratios
JPM 2015
ROE
Best-in-class
peer ROTCE5
JPM target
ROE
Consumer &
Community
Banking
57% 54%
WFC
~50% 18% 15%
WFC
20%
Corporate &
Investment
Bank
59%157%
Citi
55%-60% 12%312%
Citi
13%
Commercial
Banking
42% 40%
PNC
35% 15% 14%
FITB
16%
Asset
Management
73% 68%
UBS WM & BLK
≤70% 21% 24%
BAC & TROW
25%+
JPMorgan Chase 58%156%155%+/- 13%412% ~15%4
1 Excludes legal expense.
2 Best-in-class overhead ratio represents implied expenses of comparable peer segments weighted by JPMorgan Chase (JPM) revenue: Wells Fargo
Community Banking (WFC), Citi Institutional Clients Group (Citi), PNC Corporate and Institutional Banking (PNC), UBS Wealth Management and
Wealth Management Americas (UBS WM) and BlackRock (BLK). JPM overhead ratio represents the sum of the implied expenses of all peers and
JPM Corporate segment divided by JPM revenue.
3 CIB ROE excluding legal expense was 14%.
4 Represents firmwide ROTCE for JPM. Goodwill is primarily related to the Bank One merger and prior acquisitions and is predominantly retained
by Corporate.
5 Best-in-class ROTCE represents implied net income minus preferred stock dividends (NIAC) for each comparable LOB peer weighted by JPM average
tangible common equity: WFC, Citi Institutional Clients Group (Citi), Fifth Third Bank (FITB), Bank of America Global Wealth and Investment Manage-
ment (BAC), T. Rowe Price (TROW). JPM ROTCE represents the sum of the implied combined NIAC of all peers and JPM Corporate segment divided by
JPM average tangible equity.
JPMorgan Chase is in Line with Best-in-Class Peers in Both Eciency and Returns