JP Morgan Chase 2015 Annual Report Download - page 14
Download and view the complete annual report
Please find page 14 of the 2015 JP Morgan Chase annual report below. You can navigate through the pages in the report by either clicking on the pages listed below, or by using the keyword search tool below to find specific information within the annual report.-
 1
1 -
2
-
3
-
 4
4 -
 5
5 -
 6
6 -
 7
7 -
 8
8 -
 9
9 -
 10
10 -
 11
11 -
 12
12 -
 13
13 -
 14
14 -
 15
15 -
 16
16 -
 17
17 -
 18
18 -
 19
19 -
 20
20 -
 21
21 -
 22
22 -
 23
23 -
 24
24 -
25
-
26
-
27
-
28
-
29
-
30
-
31
-
32
-
33
-
34
-
35
-
36
-
37
-
38
-
39
-
40
-
41
-
42
-
43
-
44
-
45
-
46
-
47
-
48
-
49
-
50
-
51
-
52
-
53
-
54
-
55
-
56
-
57
-
58
-
59
-
60
-
61
-
62
-
63
-
64
-
65
-
66
-
67
-
68
-
69
-
70
-
71
-
72
-
73
-
74
-
75
-
76
-
77
-
78
-
79
-
80
-
81
-
82
-
83
-
84
-
85
-
86
-
87
-
88
-
89
-
90
-
91
-
92
-
93
-
94
-
95
-
96
-
97
-
98
-
99
-
100
-
101
-
102
-
103
-
104
-
105
-
106
-
107
-
108
-
109
-
110
-
111
-
112
-
113
-
114
-
115
-
116
-
117
-
118
-
119
-
120
-
121
-
122
-
123
-
124
-
125
-
126
-
127
-
128
-
129
-
130
-
131
-
132
-
133
-
134
-
135
-
136
-
137
-
138
-
139
-
140
-
141
-
142
-
143
-
144
-
145
-
146
-
147
-
148
-
149
-
150
-
151
-
152
-
153
-
154
-
155
-
156
-
157
-
158
-
159
-
160
-
161
-
162
-
163
-
164
-
165
-
166
-
167
-
168
-
169
-
170
-
171
-
172
-
173
-
174
-
175
-
176
-
177
-
178
-
179
-
180
-
181
-
182
-
183
-
184
-
185
-
186
-
187
-
188
-
189
-
190
-
191
-
192
-
193
-
194
-
195
-
196
-
197
-
198
-
199
-
200
-
201
-
202
-
203
-
204
-
205
-
206
-
207
-
208
-
209
-
210
-
211
-
212
-
213
-
214
-
215
-
216
-
217
-
218
-
219
-
220
-
221
-
222
-
223
-
224
-
225
-
226
-
227
-
228
-
229
-
230
-
231
-
232
-
233
-
234
-
235
-
236
-
237
-
238
-
239
-
240
-
241
-
242
-
243
-
244
-
245
-
246
-
247
-
248
-
249
-
250
-
251
-
252
-
253
-
254
-
255
-
256
-
257
-
258
-
259
-
260
-
261
-
262
-
263
-
264
-
265
-
266
-
267
-
268
-
269
-
270
-
271
-
272
-
273
-
274
-
275
-
276
-
277
-
278
-
279
-
280
-
281
-
282
-
283
-
284
-
285
-
286
-
287
-
288
-
289
-
290
-
291
-
292
-
293
-
294
-
295
-
296
-
297
-
298
-
299
-
300
-
301
-
302
-
303
-
304
-
305
-
306
-
307
-
308
-
309
-
310
-
311
-
312
-
313
-
314
-
315
-
316
-
317
-
318
-
319
-
320
-
321
-
322
-
323
-
324
-
325
-
326
-
327
-
328
-
329
-
330
-
331
-
332
 |
 |

1212
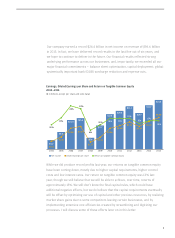
$55 billion pre-tax over a nine-quarter
period, an amount that we would easily
manage because of the strength of our
capital base. Remember, the Federal Reserve
stress test is not a forecast – it appropriately
assumes multiple levels of conservatism
and that very little mitigating action can be
taken. However, we believe that if the stress
scenario actually happened, we would incur
minimal losses over a cumulative nine-
quarter period because of the extensive miti-
gating actions that we would take. It bears
repeating that in the actual Great Recession,
which was not unlike last year’s stress test,
JPMorgan Chase never lost money in any
quarter and was quite profitable over the
nine-quarter period.
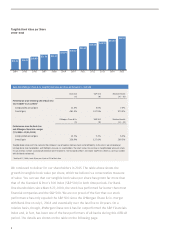
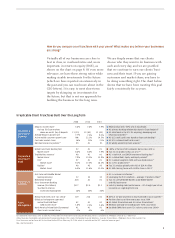
The stress test is extremely severe on credit.
The 2015 Comprehensive Capital Analysis
and Review (CCAR), or stress test, projected
credit losses over a nine-quarter period
that totaled approximately $50 billion for
JPMorgan Chase, or 6.4% of all our loans.
This is higher than what the actual cumula-
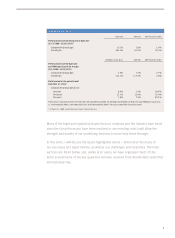
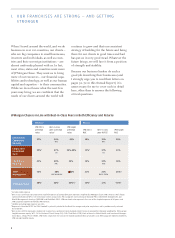
Our Fortress Balance Sheet
at December 31,
2007 2014 2015
CET1 7.0 %210.2%311.6%3
TCE/
Total assets14.9% 6.6% 7.7%
Tangible
common equity $74B $166B $176B
Total assets
$1.6T $2.6T $2.4T
RWA
$1.1T2$1.6T3$1.5T3
Level 3
assets $83B $54B $32B
Liquidity
(HQLA) N/A $600B $496B
LCR and NSFR
N/A >100% >100%
GSIB N/A 4.5% 3.5%4
1 Excludes goodwill and intangible assets. B = billions
2 Reflects Basel I measure; CET1 reflects Tier 1 common. T = trillions
3 Reflects Basel III Advanced Fully Phased-In measure. bps = basis points
4 Estimated
CET1 = Common equity Tier 1 ratio. CET1 ratios reflect the capital rule the firm was subject to at each reporting period
TCE = Tangible common equity
RWA = Risk-weighted assets
Level 3 assets = Assets whose value is estimated using model inputs that are unobservable and significant to the fair value
HQLA = High quality liquid assets predominantly include cash on deposit at central banks, and unencumbered U.S. agency
mortgage-backed securities, U.S. Treasuries and sovereign bonds
LCR and NSFR = Liquidity coverage ratio and net stable funding ratio
GSIB = Global systemically important bank. The GSIB surcharge increases the regulatory minimum capital of large banks based
on their size, cross-jurisdiction activity, interconnectedness, complexity and short-term wholesale funding
N/A = Not applicable
+110 bps
+$10B
$(200)B
$(100)B
$(22)B
Compliant
(100) bps
$(104)B
+140 bps