Honeywell 2013 Annual Report Download - page 89
Download and view the complete annual report
Please find page 89 of the 2013 Honeywell annual report below. You can navigate through the pages in the report by either clicking on the pages listed below, or by using the keyword search tool below to find specific information within the annual report.-
 1
1 -
2
-
3
-
4
-
5
-
6
-
7
-
8
-
9
-
10
-
11
-
12
-
13
-
14
-
15
-
16
-
17
-
18
-
19
-
20
-
21
-
22
-
23
-
24
-
25
-
26
-
27
-
28
-
29
-
30
-
31
-
32
-
33
-
34
-
35
-
36
-
37
-
38
-
39
-
40
-
41
-
42
-
43
-
44
-
45
-
46
-
47
-
48
-
49
-
50
-
51
-
52
-
53
-
54
-
55
-
56
-
57
-
58
-
59
-
60
-
61
-
62
-
63
-
64
-
65
-
66
-
67
-
68
-
69
-
70
-
71
-
72
-
73
-
74
-
75
-
76
-
77
-
78
-
 79
79 -
 80
80 -
 81
81 -
 82
82 -
 83
83 -
 84
84 -
 85
85 -
 86
86 -
 87
87 -
 88
88 -
 89
89 -
 90
90 -
 91
91 -
 92
92 -
 93
93 -
 94
94 -
 95
95 -
 96
96 -
 97
97 -
 98
98 -
 99
99 -
100
-
101
-
102
-
103
-
104
-
105
-
106
-
107
-
108
-
109
-
110
-
111
-
112
-
113
-
114
-
115
-
116
-
117
-
118
-
119
-
120
-
121
-
122
-
123
-
124
-
125
-
126
-
127
-
128
-
129
-
130
-
131
-
132
-
133
-
134
-
135
-
136
-
137
-
138
-
139
-
140
-
141
-
142
-
143
-
144
-
145
-
146
 |
 |

discussed in detail in Note 22 Commitments and Contingencies of Notes to the Financial Statements.
In 2013 we also recognized other charges of $9 million related to the resolution of legal matters.
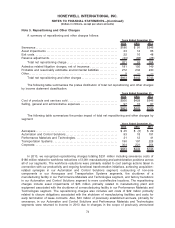
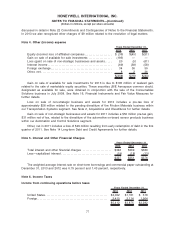
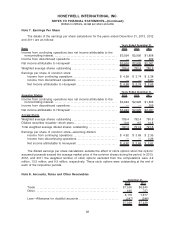
Note 4. Other (income) expense
2013 2012 2011
Years Ended December 31,
Equity (income) loss of affiliated companies . . . . . . . . . . . . . . . . . . . . $ (36) $(45) $(51)
Gain on sale of available for sale investments . . . . . . . . . . . . . . . . . (195) — —
Loss (gain) on sale of non-strategic businesses and assets. . . . . 20 (5) (61)
Interest income . . . . . . . . . . . . . . . . . . . . . . . . . . . . . . . . . . . . . . . . . . . . . . . (69) (58) (58)
Foreign exchange. . . . . . . . . . . . . . . . . . . . . . . . . . . . . . . . . . . . . . . . . . . . . 34 36 50
Other, net . . . . . . . . . . . . . . . . . . . . . . . . . . . . . . . . . . . . . . . . . . . . . . . . . . . . 8 2 36
$(238) $(70) $(84)
Gain on sale of available for sale investments for 2013 is due to $195 million of realized gain
related to the sale of marketable equity securities. These securities (B/E Aerospace common stock),
designated as available for sale, were obtained in conjunction with the sale of the Consumables
Solutions business in July 2008. See Note 16, Financial Instruments and Fair Value Measures for
further details.
Loss on sale of non-strategic business and assets for 2013 includes a pre-tax loss of
approximately $28 million related to the pending divestiture of the Friction Materials business within
our Transportation Systems segment. See Note 2, Acquisitions and Divestitures for further details.
Gain on sale of non-strategic businesses and assets for 2011 includes a $50 million pre-tax gain,
$31 million net of tax, related to the divestiture of the automotive on-board sensor products business
within our Automation and Control Solutions segment.
Other, net in 2011 includes a loss of $29 million resulting from early redemption of debt in the first
quarter of 2011. See Note 14 Long-term Debt and Credit Agreements for further details.
Note 5. Interest and Other Financial Charges
2013 2012 2011
Years Ended December 31
Total interest and other financial charges . . . . . . . . . . . . . . . . . . . . . $346 $369 $389
Less—capitalized interest . . . . . . . . . . . . . . . . . . . . . . . . . . . . . . . . . . . . . (19) (18) (13)
$327 $351 $376
The weighted average interest rate on short-term borrowings and commercial paper outstanding at
December 31, 2013 and 2012 was 0.79 percent and 1.43 percent, respectively.
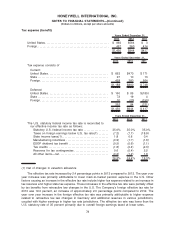
Note 6. Income Taxes
Income from continuing operations before taxes
2013 2012 2011
Years Ended December 31,
United States . . . . . . . . . . . . . . . . . . . . . . . . . . . . . . . . . . . . . . . . . . . . . . $3,002 $1,761 $ 318
Foreign. . . . . . . . . . . . . . . . . . . . . . . . . . . . . . . . . . . . . . . . . . . . . . . . . . . . 2,410 2,114 1,964
$5,412 $3,875 $2,282
77
HONEYWELL INTERNATIONAL INC.
NOTES TO FINANCIAL STATEMENTS—(Continued)
(Dollars in millions, except per share amounts)