Honeywell 2013 Annual Report Download - page 47
Download and view the complete annual report
Please find page 47 of the 2013 Honeywell annual report below. You can navigate through the pages in the report by either clicking on the pages listed below, or by using the keyword search tool below to find specific information within the annual report.-
 1
1 -
2
-
3
-
4
-
5
-
6
-
7
-
8
-
9
-
10
-
11
-
12
-
13
-
14
-
15
-
16
-
17
-
18
-
19
-
20
-
21
-
22
-
23
-
24
-
25
-
26
-
27
-
28
-
29
-
30
-
31
-
32
-
33
-
34
-
35
-
36
-
 37
37 -
 38
38 -
 39
39 -
 40
40 -
 41
41 -
 42
42 -
 43
43 -
 44
44 -
 45
45 -
 46
46 -
 47
47 -
 48
48 -
 49
49 -
 50
50 -
 51
51 -
 52
52 -
 53
53 -
 54
54 -
 55
55 -
 56
56 -
 57
57 -
58
-
59
-
60
-
61
-
62
-
63
-
64
-
65
-
66
-
67
-
68
-
69
-
70
-
71
-
72
-
73
-
74
-
75
-
76
-
77
-
78
-
79
-
80
-
81
-
82
-
83
-
84
-
85
-
86
-
87
-
88
-
89
-
90
-
91
-
92
-
93
-
94
-
95
-
96
-
97
-
98
-
99
-
100
-
101
-
102
-
103
-
104
-
105
-
106
-
107
-
108
-
109
-
110
-
111
-
112
-
113
-
114
-
115
-
116
-
117
-
118
-
119
-
120
-
121
-
122
-
123
-
124
-
125
-
126
-
127
-
128
-
129
-
130
-
131
-
132
-
133
-
134
-
135
-
136
-
137
-
138
-
139
-
140
-
141
-
142
-
143
-
144
-
145
-
146
 |
 |

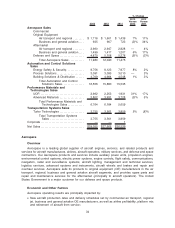
•Global demand for commercial air travel as reflected in global flying hours and utilization rates
for corporate and general aviation aircraft, as well as the demand for spare parts and
maintenance and repair services for aircraft currently in use;
•Level and mix of U.S. and foreign government appropriations for defense and space programs
and military activity;
•Changes in customer platform development schedules, requirements and demands for new
technologies;
•Availability and price variability of raw materials such as nickel, titanium and other metals; and
•International regulation affecting aircraft operating equipage.
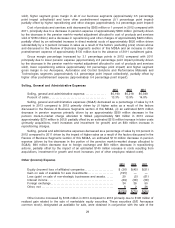
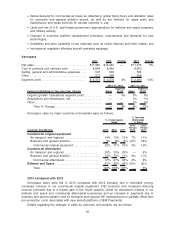
Aerospace
2013 2012 Change 2011 Change
Net sales . . . . . . . . . . . . . . . . . . . . . . . . . . . . . . . . . . . . . . $11,980 $12,040 — $11,475 5%
Cost of products and services sold . . . . . . . . . . . . . . 8,848 8,949 8,655
Selling, general and administrative expenses . . . . 547 606 589
Other . . . . . . . . . . . . . . . . . . . . . . . . . . . . . . . . . . . . . . . . . . 213 206 208
Segment profit . . . . . . . . . . . . . . . . . . . . . . . . . . . . . . . . . $ 2,372 $ 2,279 4% $ 2,023 13%
Factors Contributing to Year-Over-Year Change Sales
Segment
Profit Sales
Segment
Profit
2013 vs. 2012 2012 vs. 2011
Organic growth/ Operational segment profit . . . . . . . . . . . . . — 4% 3% 8%
Acquisitions and divestitures, net . . . . . . . . . . . . . . . . . . . . . . . — — 1% 1%
Other. . . . . . . . . . . . . . . . . . . . . . . . . . . . . . . . . . . . . . . . . . . . . . . . . . — — 1% 4%
Total % Change . . . . . . . . . . . . . . . . . . . . . . . . . . . . . . . . . . . — 4% 5% 13%
Aerospace sales by major customer end-markets were as follows:
Customer End-Markets 2013 2012 2011
2013
Versus
2012
2012
Versus
2011
% of Aerospace
Sales
% Increase
(Decrease)
in Sales
Commercial original equipment
Air transport and regional . . . . . . . . . . . . . . . . . . . . . . . . . . 14% 13% 13% 7% 11%
Business and general aviation . . . . . . . . . . . . . . . . . . . . . . 8% 8% 6% (3)% 34%
Commercial original equipment . . . . . . . . . . . . . . . . . . . 22% 21% 19% 3% 19%
Commercial aftermarket
Air transport and regional . . . . . . . . . . . . . . . . . . . . . . . . . . 25% 25% 25% — 4%
Business and general aviation . . . . . . . . . . . . . . . . . . . . . . 12% 12% 11% 6% 17%
Commercial aftermarket . . . . . . . . . . . . . . . . . . . . . . . . . . 37% 37% 36% 2% 8%
Defense and Space . . . . . . . . . . . . . . . . . . . . . . . . . . . . . . . . . 41% 42% 45% (5)% (3)%
Total . . . . . . . . . . . . . . . . . . . . . . . . . . . . . . . . . . . . . . . . . . . . 100% 100% 100% — 5%
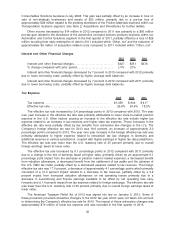
2013 compared with 2012
Aerospace sales were flat in 2013 compared with 2012 primarily due to favorable pricing,
increased volumes in our commercial original equipment (OE) business and increased licensing
revenue (primarily due to a royalty gain in the fourth quarter), offset by decreased volumes in our
defense and space and commercial aftermarket businesses and an increase in payments due to
business and general aviation and air transport and regional OE manufacturers to partially offset their
pre-production costs associated with new aircraft platforms (OEM Payments).
Details regarding the changes in sales by customer end-markets are as follows:
35