Honeywell 2013 Annual Report Download - page 2
Download and view the complete annual report
Please find page 2 of the 2013 Honeywell annual report below. You can navigate through the pages in the report by either clicking on the pages listed below, or by using the keyword search tool below to find specific information within the annual report.-
 1
1 -
 2
2 -
 3
3 -
 4
4 -
 5
5 -
 6
6 -
 7
7 -
 8
8 -
 9
9 -
 10
10 -
 11
11 -
 12
12 -
 13
13 -
14
-
15
-
16
-
17
-
18
-
19
-
20
-
21
-
22
-
23
-
24
-
25
-
26
-
27
-
28
-
29
-
30
-
31
-
32
-
33
-
34
-
35
-
36
-
37
-
38
-
39
-
40
-
41
-
42
-
43
-
44
-
45
-
46
-
47
-
48
-
49
-
50
-
51
-
52
-
53
-
54
-
55
-
56
-
57
-
58
-
59
-
60
-
61
-
62
-
63
-
64
-
65
-
66
-
67
-
68
-
69
-
70
-
71
-
72
-
73
-
74
-
75
-
76
-
77
-
78
-
79
-
80
-
81
-
82
-
83
-
84
-
85
-
86
-
87
-
88
-
89
-
90
-
91
-
92
-
93
-
94
-
95
-
96
-
97
-
98
-
99
-
100
-
101
-
102
-
103
-
104
-
105
-
106
-
107
-
108
-
109
-
110
-
111
-
112
-
113
-
114
-
115
-
116
-
117
-
118
-
119
-
120
-
121
-
122
-
123
-
124
-
125
-
126
-
127
-
128
-
129
-
130
-
131
-
132
-
133
-
134
-
135
-
136
-
137
-
138
-
139
-
140
-
141
-
142
-
143
-
144
-
145
-
146
 |
 |
SHAREOWNER LETTER—2014
March 1, 2014
We had very good performance in another “weakish” year in the global economy. We
were able to grow sales 4% to $39.1 billion and earnings per share* by 11% to $4.97. Our
segment margin rate grew 70 basis points to 16.3% and free cash flow** grew to $3.8 billion, a
96% conversion rate.** As usual, we also took the opportunity to continue our seed
planting…products, technologies, restructuring, geographies, services, processes, new
capacity…to ensure that growth continues far into the future.
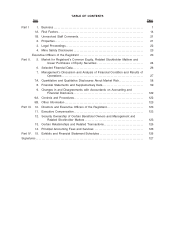
Five-Year Plan
The year 2014 is the last in the five-year plan (2010-2014) Honeywell introduced in
March 2010. Despite economic and foreign exchange headwinds versus what we assumed
then, we’ve performed quite well as you can see from the chart below.
$30.0
$39.1
$41.0 -
45.0
$40.3 -
40.7
2009 2013 2014E 2014 Target
Sales ($B)
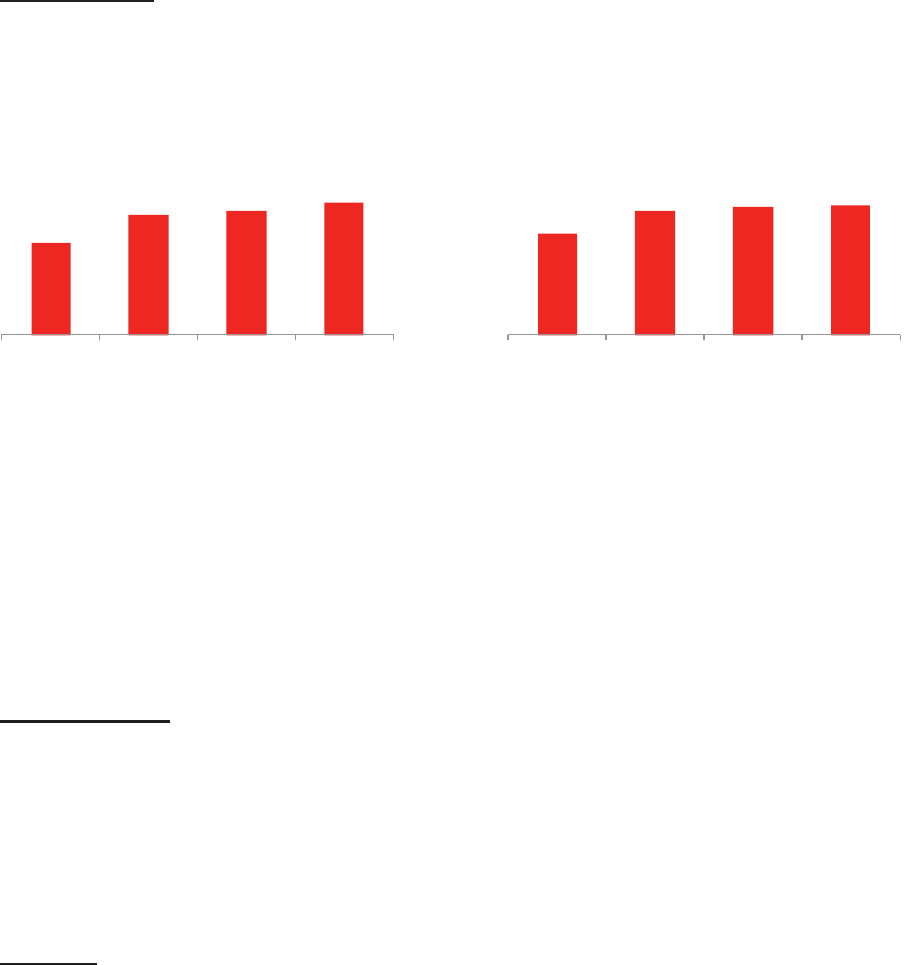
13.3%
16.3%
16.0 -
18.0%
16.6 -
16.9%
2009 2013 2014E 2014 Target
Segment Margin Rate
We estimate that those headwinds versus our original macro assumptions cost us about
$3 billion in sales over the 2010-2014 period. Even with those headwinds, we expect to
almost touch the bottom of the targeted sales range growing sales 6% annually and expect to
be around the midpoint of the margin rate range (a margin rate increase of approximately 350
basis points).
While there was a lot of skepticism in 2010 about our five-year plan, our performance
has generated a lot of interest in the next five-year plan covering 2014-2018. We will be
introducing it at Investor Day on March 5. Our intent, of course, is to continue outperforming
our peers, and we look forward to discussing it with you.
Business Model
That outperformance will continue through the application of our Business Model…a
great portfolio of businesses, a focus on internal processes, and a culture that learns,
evolves, and performs. With the recently announced divestiture of Friction Materials, we’re
now at a point where 99% of the Company’s sales come from Great Positions in Good
Industries. That is, markets where we can win with differentiated technology. That’s a nice
position to be in and allows us to use our disciplined acquisition process to fuel further
growth.
* Proforma, V% exclude pension mark-to-market adjustment
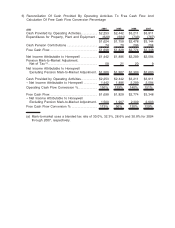
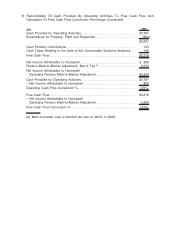
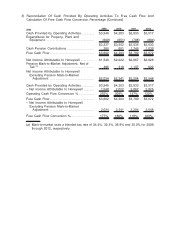
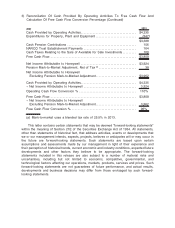
** Free cash flow (cash flow from operations less capital expenditures) and free cash flow conversion prior to any cash pension
contributions, NARCO Trust establishment payments and cash taxes relating to the sale of available for sale investments