Honeywell 2013 Annual Report Download - page 56
Download and view the complete annual report
Please find page 56 of the 2013 Honeywell annual report below. You can navigate through the pages in the report by either clicking on the pages listed below, or by using the keyword search tool below to find specific information within the annual report.-
 1
1 -
2
-
3
-
4
-
5
-
6
-
7
-
8
-
9
-
10
-
11
-
12
-
13
-
14
-
15
-
16
-
17
-
18
-
19
-
20
-
21
-
22
-
23
-
24
-
25
-
26
-
27
-
28
-
29
-
30
-
31
-
32
-
33
-
34
-
35
-
36
-
37
-
38
-
39
-
40
-
41
-
42
-
43
-
44
-
45
-
 46
46 -
 47
47 -
 48
48 -
 49
49 -
 50
50 -
 51
51 -
 52
52 -
 53
53 -
 54
54 -
 55
55 -
 56
56 -
 57
57 -
 58
58 -
 59
59 -
 60
60 -
 61
61 -
 62
62 -
 63
63 -
 64
64 -
 65
65 -
 66
66 -
67
-
68
-
69
-
70
-
71
-
72
-
73
-
74
-
75
-
76
-
77
-
78
-
79
-
80
-
81
-
82
-
83
-
84
-
85
-
86
-
87
-
88
-
89
-
90
-
91
-
92
-
93
-
94
-
95
-
96
-
97
-
98
-
99
-
100
-
101
-
102
-
103
-
104
-
105
-
106
-
107
-
108
-
109
-
110
-
111
-
112
-
113
-
114
-
115
-
116
-
117
-
118
-
119
-
120
-
121
-
122
-
123
-
124
-
125
-
126
-
127
-
128
-
129
-
130
-
131
-
132
-
133
-
134
-
135
-
136
-
137
-
138
-
139
-
140
-
141
-
142
-
143
-
144
-
145
-
146
 |
 |

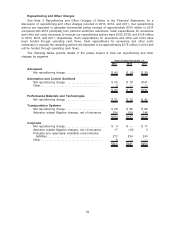
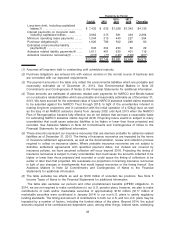
Repositioning and Other Charges
See Note 3 Repositioning and Other Charges of Notes to the Financial Statements for a
discussion of repositioning and other charges incurred in 2013, 2012, and 2011. Our repositioning
actions are expected to generate incremental pretax savings of approximately $150 million in 2014
compared with 2013 principally from planned workforce reductions. Cash expenditures for severance
and other exit costs necessary to execute our repositioning actions were $160, $136, and $159 million
in 2013, 2012, and 2011, respectively. Such expenditures for severance and other exit costs have
been funded through operating cash flows. Cash expenditures for severance and other costs
necessary to execute the remaining actions are expected to be approximately $175 million in 2014 and
will be funded through operating cash flows.
The following tables provide details of the pretax impact of total net repositioning and other
charges by segment.
2013 2012 2011
Years Ended December 31,
Aerospace
Net repositioning charge . . . . . . . . . . . . . . . . . . . . . . . . . . . $ 45 $ (5) $ 29
Automation and Control Solutions
Net repositioning charge . . . . . . . . . . . . . . . . . . . . . . . . . . . $ 90 $ 18 $191
Other. . . . . . . . . . . . . . . . . . . . . . . . . . . . . . . . . . . . . . . . . . . . . . 3 — —
$ 93 $ 18 $191
Performance Materials and Technologies
Net repositioning charge . . . . . . . . . . . . . . . . . . . . . . . . . . . $ 31 $ 12 $ 41
Transportation Systems
Net repositioning charge . . . . . . . . . . . . . . . . . . . . . . . . . . . $ 26 $ 28 $ 82
Asbestos related litigation charges, net of insurance . 164 169 146
$190 $197 $228
Corporate
Net repositioning charge . . . . . . . . . . . . . . . . . . . . . . . . . . . $ 9 $ — $ 11
Asbestos related litigation charges, net of insurance . 17 (13) 3
Probable and reasonably estimable environmental
liabilities . . . . . . . . . . . . . . . . . . . . . . . . . . . . . . . . . . . . . . . . . 272 234 240
Other. . . . . . . . . . . . . . . . . . . . . . . . . . . . . . . . . . . . . . . . . . . . . . 6 — —
$304 $221 $254
44