Honeywell 2013 Annual Report Download - page 88
Download and view the complete annual report
Please find page 88 of the 2013 Honeywell annual report below. You can navigate through the pages in the report by either clicking on the pages listed below, or by using the keyword search tool below to find specific information within the annual report.-
 1
1 -
2
-
3
-
4
-
5
-
6
-
7
-
8
-
9
-
10
-
11
-
12
-
13
-
14
-
15
-
16
-
17
-
18
-
19
-
20
-
21
-
22
-
23
-
24
-
25
-
26
-
27
-
28
-
29
-
30
-
31
-
32
-
33
-
34
-
35
-
36
-
37
-
38
-
39
-
40
-
41
-
42
-
43
-
44
-
45
-
46
-
47
-
48
-
49
-
50
-
51
-
52
-
53
-
54
-
55
-
56
-
57
-
58
-
59
-
60
-
61
-
62
-
63
-
64
-
65
-
66
-
67
-
68
-
69
-
70
-
71
-
72
-
73
-
74
-
75
-
76
-
77
-
 78
78 -
 79
79 -
 80
80 -
 81
81 -
 82
82 -
 83
83 -
 84
84 -
 85
85 -
 86
86 -
 87
87 -
 88
88 -
 89
89 -
 90
90 -
 91
91 -
 92
92 -
 93
93 -
 94
94 -
 95
95 -
 96
96 -
 97
97 -
 98
98 -
99
-
100
-
101
-
102
-
103
-
104
-
105
-
106
-
107
-
108
-
109
-
110
-
111
-
112
-
113
-
114
-
115
-
116
-
117
-
118
-
119
-
120
-
121
-
122
-
123
-
124
-
125
-
126
-
127
-
128
-
129
-
130
-
131
-
132
-
133
-
134
-
135
-
136
-
137
-
138
-
139
-
140
-
141
-
142
-
143
-
144
-
145
-
146
 |
 |

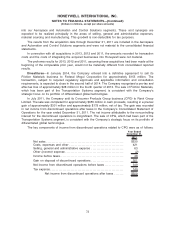
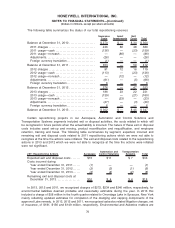
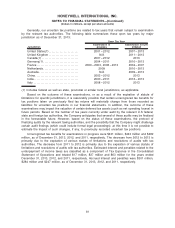
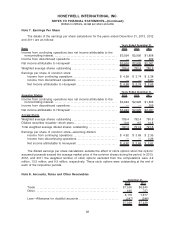
The following table summarizes the status of our total repositioning reserves:
Severance
Costs
Asset
Impairments
Exit
Costs Total
Balance at December 31, 2010 . . . . . . . . . . . . . . . . . . . $ 270 $ — $ 34 $ 304
2011 charges . . . . . . . . . . . . . . . . . . . . . . . . . . . . . . . . . . 246 86 48 380
2011 usage—cash . . . . . . . . . . . . . . . . . . . . . . . . . . . . . (136) — (23) (159)
2011 usage—noncash . . . . . . . . . . . . . . . . . . . . . . . . . . — (86) — (86)
Adjustments. . . . . . . . . . . . . . . . . . . . . . . . . . . . . . . . . . . . (26) — — (26)
Foreign currency translation. . . . . . . . . . . . . . . . . . . . . (1) — — (1)
Balance at December 31, 2011 . . . . . . . . . . . . . . . . . . . 353 — 59 412
2012 charges . . . . . . . . . . . . . . . . . . . . . . . . . . . . . . . . . . 91 12 16 119
2012 usage—cash . . . . . . . . . . . . . . . . . . . . . . . . . . . . . (113) — (23) (136)
2012 usage—noncash . . . . . . . . . . . . . . . . . . . . . . . . . . — (12) — (12)
Adjustments. . . . . . . . . . . . . . . . . . . . . . . . . . . . . . . . . . . . (61) — (5) (66)
Foreign currency translation. . . . . . . . . . . . . . . . . . . . . 6 — — 6
Balance at December 31, 2012 . . . . . . . . . . . . . . . . . . . 276 — 47 323
2013 charges . . . . . . . . . . . . . . . . . . . . . . . . . . . . . . . . . . 186 23 22 231
2013 usage—cash . . . . . . . . . . . . . . . . . . . . . . . . . . . . . (139) — (21) (160)
2013 usage—noncash . . . . . . . . . . . . . . . . . . . . . . . . . . — (23) — (23)
Adjustments. . . . . . . . . . . . . . . . . . . . . . . . . . . . . . . . . . . . (27) — (3) (30)
Foreign currency translation. . . . . . . . . . . . . . . . . . . . . 6 — — 6
Balance at December 31, 2013 . . . . . . . . . . . . . . . . . . . $ 302 $ — $ 45 $ 347
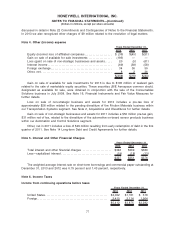
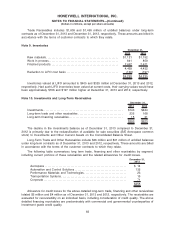
Certain repositioning projects in our Aerospace, Automation and Control Solutions and
Transportation Systems segments included exit or disposal activities, the costs related to which will
be recognized in future periods when the actual liability is incurred. The nature of these exit or disposal
costs includes asset set-up and moving, product recertification and requalification, and employee
retention, training and travel. The following table summarizes by segment, expected, incurred and
remaining exit and disposal costs related to 2011 repositioning actions which we were not able to
recognize at the time the actions were initiated. The exit and disposal costs related to the repositioning
actions in 2013 and 2012 which we were not able to recognize at the time the actions were initiated
were not significant.
2011 Repositioning Actions Aerospace
Automation and
Control Solutions
Transportation
Systems Total
Expected exit and disposal costs . . . . . . . $15 $11 $ 7 $33
Costs incurred during:
Year ended December 31, 2011. . . . . . (1) — — (1)
Year ended December 31, 2012. . . . . . (2) (3) (1) (6)
Year ended December 31, 2013. . . . . . (2) (4) (2) (8)
Remaining exit and disposal costs at
December 31, 2013. . . . . . . . . . . . . . . . . . $10 $ 4 $ 4 $18
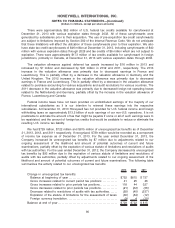
In 2013, 2012 and 2011, we recognized charges of $272, $234 and $240 million, respectively, for
environmental liabilities deemed probable and reasonably estimable during the year. In 2013 this
included a charge of $58 million in the fourth quarter related to Onondaga Lake in Syracuse, New York
mainly reflecting updated estimates for completion of the dredging and capping components of the
approved Lake remedy. In 2013, 2012 and 2011, we recognized asbestos related litigation charges, net
of insurance, of $181, $156 and $149 million, respectively. Environmental and Asbestos matters are
76
HONEYWELL INTERNATIONAL INC.
NOTES TO FINANCIAL STATEMENTS—(Continued)
(Dollars in millions, except per share amounts)