Honeywell 2013 Annual Report Download - page 67
Download and view the complete annual report
Please find page 67 of the 2013 Honeywell annual report below. You can navigate through the pages in the report by either clicking on the pages listed below, or by using the keyword search tool below to find specific information within the annual report.-
 1
1 -
2
-
3
-
4
-
5
-
6
-
7
-
8
-
9
-
10
-
11
-
12
-
13
-
14
-
15
-
16
-
17
-
18
-
19
-
20
-
21
-
22
-
23
-
24
-
25
-
26
-
27
-
28
-
29
-
30
-
31
-
32
-
33
-
34
-
35
-
36
-
37
-
38
-
39
-
40
-
41
-
42
-
43
-
44
-
45
-
46
-
47
-
48
-
49
-
50
-
51
-
52
-
53
-
54
-
55
-
56
-
 57
57 -
 58
58 -
 59
59 -
 60
60 -
 61
61 -
 62
62 -
 63
63 -
 64
64 -
 65
65 -
 66
66 -
 67
67 -
 68
68 -
 69
69 -
 70
70 -
 71
71 -
 72
72 -
 73
73 -
 74
74 -
 75
75 -
 76
76 -
 77
77 -
78
-
79
-
80
-
81
-
82
-
83
-
84
-
85
-
86
-
87
-
88
-
89
-
90
-
91
-
92
-
93
-
94
-
95
-
96
-
97
-
98
-
99
-
100
-
101
-
102
-
103
-
104
-
105
-
106
-
107
-
108
-
109
-
110
-
111
-
112
-
113
-
114
-
115
-
116
-
117
-
118
-
119
-
120
-
121
-
122
-
123
-
124
-
125
-
126
-
127
-
128
-
129
-
130
-
131
-
132
-
133
-
134
-
135
-
136
-
137
-
138
-
139
-
140
-
141
-
142
-
143
-
144
-
145
-
146
 |
 |

use an expected rate of return on plan assets of 7.75 percent for 2014 as this is a long-term rate based
on historical plan asset returns over varying long term periods combined with our expectations on
future market conditions and the asset mix of the plan’s investments.
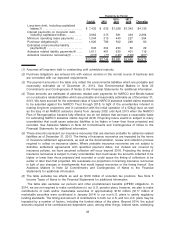
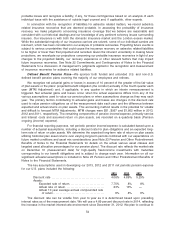
In addition to the potential for MTM Adjustments, changes in our expected rate of return on plan
assets and discount rate resulting from economic events also affects future pension ongoing (income)
expense. The following table highlights the sensitivity of our U.S. pension obligations and ongoing
(income) expense to changes in these assumptions, assuming all other assumptions remain constant.
These estimates exclude any potential MTM Adjustment:
Change in Assumption
Impact on 2014
Pension Ongoing
Expense Impact on PBO
0.25 percentage point decrease in discount rate . . Decrease $4 million Increase $529 million
0.25 percentage point increase in discount rate . . . Increase $3 million Decrease $512 million
0.25 percentage point decrease in expected rate
of return on assets . . . . . . . . . . . . . . . . . . . . . . . . . . . . Increase $40 million —
0.25 percentage point increase in expected rate
of return on assets . . . . . . . . . . . . . . . . . . . . . . . . . . . . Decrease $40 million —
Pension ongoing income for all of our pension plans is expected to be approximately $230 million
in 2014 compared with pension ongoing income of $90 million in 2013. The increase in pension
ongoing income in 2014 compared with 2013 results primarily from an increase in the plans’ assets at
December 31, 2013 compared with December 31, 2012 mainly due to strong asset returns in 2013.
Also, if required, an MTM Adjustment will be recorded in the fourth quarter of 2014 in accordance with
our pension accounting method as previously described. It is difficult to reliably forecast or predict
whether there will be a MTM Adjustment in 2014, and if one is required what the magnitude of such
adjustment will be. MTM Adjustments are primarily driven by events and circumstances beyond the
control of the Company such as changes in interest rates and the performance of the financial
markets.
In 2013, 2012 and 2011, we were not required to make contributions to satisfy minimum statutory
funding requirements in our U.S. pension plans and did not make a contribution to our U.S. plans
during 2013. However, we made voluntary contributions of $792 and $1,650 million to our U.S. pension
plans in 2012 and 2011, respectively, primarily to improve the funded status of our plans which had
been adversely impacted by relatively low discount rates and asset losses in 2011 and 2008 resulting
from the poor performance of the equity markets. In 2014, we are not required to make contributions to
our U.S. pension plans. We plan to make contributions of cash and/or marketable securities of
approximately $150 million ($117 million of marketable securities were contributed in January 2014) to
our non-U.S. plans to satisfy regulatory funding standards. The timing and amount of contributions to
both our U.S. and non-U.S. plans may be impacted by a number of factors, including the funded status
of the plans.
Long-Lived Assets (including Tangible and Finite-Lived Intangible Assets)—To conduct our
global business operations and execute our business strategy, we acquire tangible and intangible
assets, including property, plant and equipment and finite-lived intangible assets. At December 31,
2013, the net carrying amount of these long-lived assets totaled approximately $7.1 billion. The
determination of useful lives (for depreciation/amortization purposes) and whether or not these assets
are impaired involves the use of accounting estimates and assumptions, changes in which could
materially impact our financial condition or operating performance if actual results differ from such
estimates and assumptions. We evaluate the recoverability of the carrying amount of our long-lived
assets whenever events or changes in circumstances indicate that the carrying amount of a long-lived
asset group may not be fully recoverable. The principal factors in considering when to perform an
impairment review are as follows:
•Significant under-performance (i.e., declines in sales, earnings or cash flows) of a business or
product line in relation to expectations;
•Annual operating plans or five-year strategic plans that indicate an unfavorable trend in
operating performance of a business or product line;
55