Honeywell 2013 Annual Report Download - page 8
Download and view the complete annual report
Please find page 8 of the 2013 Honeywell annual report below. You can navigate through the pages in the report by either clicking on the pages listed below, or by using the keyword search tool below to find specific information within the annual report.-
 1
1 -
 2
2 -
 3
3 -
 4
4 -
 5
5 -
 6
6 -
 7
7 -
 8
8 -
 9
9 -
 10
10 -
 11
11 -
 12
12 -
 13
13 -
 14
14 -
 15
15 -
 16
16 -
 17
17 -
 18
18 -
 19
19 -
20
-
21
-
22
-
23
-
24
-
25
-
26
-
27
-
28
-
29
-
30
-
31
-
32
-
33
-
34
-
35
-
36
-
37
-
38
-
39
-
40
-
41
-
42
-
43
-
44
-
45
-
46
-
47
-
48
-
49
-
50
-
51
-
52
-
53
-
54
-
55
-
56
-
57
-
58
-
59
-
60
-
61
-
62
-
63
-
64
-
65
-
66
-
67
-
68
-
69
-
70
-
71
-
72
-
73
-
74
-
75
-
76
-
77
-
78
-
79
-
80
-
81
-
82
-
83
-
84
-
85
-
86
-
87
-
88
-
89
-
90
-
91
-
92
-
93
-
94
-
95
-
96
-
97
-
98
-
99
-
100
-
101
-
102
-
103
-
104
-
105
-
106
-
107
-
108
-
109
-
110
-
111
-
112
-
113
-
114
-
115
-
116
-
117
-
118
-
119
-
120
-
121
-
122
-
123
-
124
-
125
-
126
-
127
-
128
-
129
-
130
-
131
-
132
-
133
-
134
-
135
-
136
-
137
-
138
-
139
-
140
-
141
-
142
-
143
-
144
-
145
-
146
 |
 |

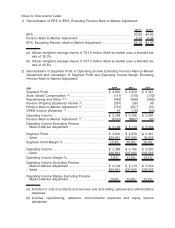
3) Reconciliation Of Cash Provided By Operating Activities To Free Cash Flow And
Calculation Of Free Cash Flow Conversion Percentage (Continued)
($M) 2008
Cash Provided by Operating Activities..................................... $3,791
Expenditures for Property, Plant and Equipment ........................... (884)
$2,907
Cash Pension Contributions . . ............................................ 143
Cash Taxes Relating to the Sale of the Consumable Solutions Business . . . 166
Free Cash Flow.......................................................... $3,216
Net Income Attributable to Honeywell ..................................... $ 806
Pension Mark-to-Market Adjustment, Net of Tax (a) ......................... 2,033
Net Income Attributable to Honeywell
Excluding Pension Mark-to-Market Adjustment........................... $2,839
Cash Provided by Operating Activities..................................... $3,791
÷Net Income Attributable to Honeywell ................................... 806
Operating Cash Flow Conversion % . ..................................... 470%
Free Cash Flow.......................................................... $3,216
÷Net Income Attributable to Honeywell
Excluding Pension Mark-to-Market Adjustment........................... 2,839
Free Cash Flow Conversion % ........................................... 113%
(a) Mark-to-market uses a blended tax rate of 38.2% in 2008.