Honeywell 2013 Annual Report Download - page 39
Download and view the complete annual report
Please find page 39 of the 2013 Honeywell annual report below. You can navigate through the pages in the report by either clicking on the pages listed below, or by using the keyword search tool below to find specific information within the annual report.-
 1
1 -
2
-
3
-
4
-
5
-
6
-
7
-
8
-
9
-
10
-
11
-
12
-
13
-
14
-
15
-
16
-
17
-
18
-
19
-
20
-
21
-
22
-
23
-
24
-
25
-
26
-
27
-
28
-
 29
29 -
 30
30 -
 31
31 -
 32
32 -
 33
33 -
 34
34 -
 35
35 -
 36
36 -
 37
37 -
 38
38 -
 39
39 -
 40
40 -
 41
41 -
 42
42 -
 43
43 -
 44
44 -
 45
45 -
 46
46 -
 47
47 -
 48
48 -
 49
49 -
50
-
51
-
52
-
53
-
54
-
55
-
56
-
57
-
58
-
59
-
60
-
61
-
62
-
63
-
64
-
65
-
66
-
67
-
68
-
69
-
70
-
71
-
72
-
73
-
74
-
75
-
76
-
77
-
78
-
79
-
80
-
81
-
82
-
83
-
84
-
85
-
86
-
87
-
88
-
89
-
90
-
91
-
92
-
93
-
94
-
95
-
96
-
97
-
98
-
99
-
100
-
101
-
102
-
103
-
104
-
105
-
106
-
107
-
108
-
109
-
110
-
111
-
112
-
113
-
114
-
115
-
116
-
117
-
118
-
119
-
120
-
121
-
122
-
123
-
124
-
125
-
126
-
127
-
128
-
129
-
130
-
131
-
132
-
133
-
134
-
135
-
136
-
137
-
138
-
139
-
140
-
141
-
142
-
143
-
144
-
145
-
146
 |
 |
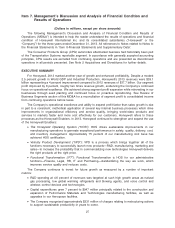
Item 7. Management’s Discussion and Analysis of Financial Condition and
Results of Operations
(Dollars in millions, except per share amounts)
The following Management’s Discussion and Analysis of Financial Condition and Results of
Operations (“MD&A”) is intended to help the reader understand the results of operations and financial
condition of Honeywell International Inc. and its consolidated subsidiaries (“Honeywell” or the
“Company”) for the three years ended December 31, 2013. All references to Notes related to Notes to
the Financial Statements in “Item 8-Financial Statements and Supplementary Data”.
The Consumer Products Group (CPG) automotive aftermarket business had historically been part
of the Transportation Systems reportable segment. In accordance with generally accepted accounting
principles, CPG results are excluded from continuing operations and are presented as discontinued
operations in all periods presented. See Note 2 Acquisitions and Divestitures for further details.
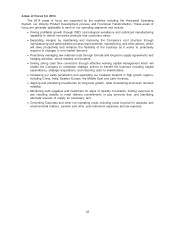
EXECUTIVE SUMMARY
For Honeywell, 2013 marked another year of growth and enhanced profitability. Despite a modest
2.5 percent growth in World GDP and Industrial Production, Honeywell’s 2013 revenues were $39.1
billion representing a 4 percent improvement compared to 2012 revenues of $37.7 billion. Our segment
profit improved by 8 percent, roughly two times revenue growth, evidencing the Company’s continued
focus on operational excellence. We achieved strong segment profit expansion while reinvesting in our
businesses through seed planting and continued focus on proactive repositioning. See Review of
Business Segments section of this MD&A for a reconciliation of segment profit to consolidated income
from continuing operations before taxes.
The Company’s operational excellence and ability to expand profit faster than sales growth is due
in part to a consistent, methodical application of several key internal business processes which drive
improvements in organizational efficiency and service quality, bringing world-class products and
services to markets faster and more cost effectively for our customers. Honeywell refers to these
processes as the Honeywell Enablers. In 2013, Honeywell continued to strengthen and expand the use
of the Honeywell Enablers:
•The Honeywell Operating System (“HOS”): HOS drives sustainable improvements in our
manufacturing operations to generate exceptional performance in safety, quality, delivery, cost,
and inventory management. Approximately 75 percent of our manufacturing cost base has
achieved HOS certification.
•Velocity Product Development (“VPD”): VPD is a process which brings together all of the
functions necessary to successfully launch new products—R&D, manufacturing, marketing and
sales—to increase the probability that in commercializing new technologies Honeywell delivers
the right products at the right price.
•Functional Transformation (“FT”): Functional Transformation is HOS for our administrative
functions—Finance, Legal, HR, IT and Purchasing—standardizing the way we work, which
improves service quality and reduces costs.
The Company continues to invest for future growth as measured by a number of important
metrics:
•R&D spending at 4.6 percent of revenues was targeted at such high growth areas as natural
gas processing, low global warming refrigerants and blowing agents, and voice control and
wireless control devices and technologies.
•Capital expenditures grew 7 percent to $947 million principally related to the construction and
expansion of Performance Materials and Technologies manufacturing facilities, as well as
upgrades to our Aerospace facilities.
•The Company recognized approximately $231 million of charges relating to restructuring actions
to support sustainable productivity in years to come.
27