Honeywell 2013 Annual Report Download - page 40
Download and view the complete annual report
Please find page 40 of the 2013 Honeywell annual report below. You can navigate through the pages in the report by either clicking on the pages listed below, or by using the keyword search tool below to find specific information within the annual report.-
 1
1 -
2
-
3
-
4
-
5
-
6
-
7
-
8
-
9
-
10
-
11
-
12
-
13
-
14
-
15
-
16
-
17
-
18
-
19
-
20
-
21
-
22
-
23
-
24
-
25
-
26
-
27
-
28
-
29
-
 30
30 -
 31
31 -
 32
32 -
 33
33 -
 34
34 -
 35
35 -
 36
36 -
 37
37 -
 38
38 -
 39
39 -
 40
40 -
 41
41 -
 42
42 -
 43
43 -
 44
44 -
 45
45 -
 46
46 -
 47
47 -
 48
48 -
 49
49 -
 50
50 -
51
-
52
-
53
-
54
-
55
-
56
-
57
-
58
-
59
-
60
-
61
-
62
-
63
-
64
-
65
-
66
-
67
-
68
-
69
-
70
-
71
-
72
-
73
-
74
-
75
-
76
-
77
-
78
-
79
-
80
-
81
-
82
-
83
-
84
-
85
-
86
-
87
-
88
-
89
-
90
-
91
-
92
-
93
-
94
-
95
-
96
-
97
-
98
-
99
-
100
-
101
-
102
-
103
-
104
-
105
-
106
-
107
-
108
-
109
-
110
-
111
-
112
-
113
-
114
-
115
-
116
-
117
-
118
-
119
-
120
-
121
-
122
-
123
-
124
-
125
-
126
-
127
-
128
-
129
-
130
-
131
-
132
-
133
-
134
-
135
-
136
-
137
-
138
-
139
-
140
-
141
-
142
-
143
-
144
-
145
-
146
 |
 |

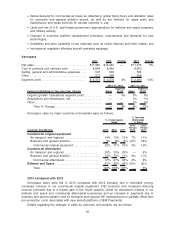
•The Company completed $1,133 million (net of cash acquired) in acquisitions in 2013, including
the acquisition of Intermec, Inc. (“Intermec”), a leading provider of mobile computing, radio
frequency identification solutions (RFID) and bar code, label and receipt printers for use in
warehousing, supply chain, field service and manufacturing environments and RAE Systems,
Inc. (RAE), a global manufacturer of fixed and portable gas and radiation detection systems, and
software.
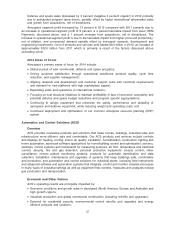
•The Company continued to monitor its portfolio of businesses and to divest those that do not fit
within our long-term strategic plan. In January 2014, the Company entered into a definitive
agreement to sell its Friction Materials business for approximately $155 million.
•Expansion of Honeywell’s presence and sales in high growth regions and countries such as
China, India, Eastern Europe, the Middle-East, and Latin America. Sales to customers outside
the United States now account for approximately 55 percent of total revenues.
Operating cash flow grew by 23 percent in 2013 to $4,335 million. This operating cash flow
performance enabled us to invest $947 million in capital expenditures, partially fund the acquisitions
discussed above, make $156 million in non-U.S. pension contributions, provide a 10 percent increase
in the Company’s cash dividend rate (vs. 2012) and repurchase 13.5 million shares of common stock.
CONSOLIDATED RESULTS OF OPERATIONS
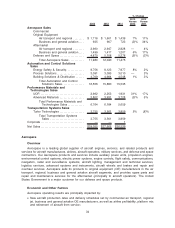
Net Sales
2013 2012 2011
Net sales . . . . . . . . . . . . . . . . . . . . . . . . . . . . . . . . . . . . . . . . . . . . . $39,055 $37,665 $36,529
% change compared with prior period. . . . . . . . . . . . . . . . . . 4% 3%
The change in net sales compared to the prior year period is attributable to the following:
2013
Versus
2012
2012
Versus
2011
Volume . . . . . . . . . . . . . . . . . . . . . . . . . . . . . . . . . . . . . . . . . . . . . . . . . . . . . . . . . . . . . . 1% 2%
Price. . . . . . . . . . . . . . . . . . . . . . . . . . . . . . . . . . . . . . . . . . . . . . . . . . . . . . . . . . . . . . . . . 1% 1%
Acquisitions/Divestitures . . . . . . . . . . . . . . . . . . . . . . . . . . . . . . . . . . . . . . . . . . . . . . 2% 2%
Foreign Exchange . . . . . . . . . . . . . . . . . . . . . . . . . . . . . . . . . . . . . . . . . . . . . . . . . . . . — (2)%
4% 3%
A discussion of net sales by segment can be found in the Review of Business Segments section
of this MD&A.
Cost of Products and Services Sold
2013 2012 2011
Cost of products and services sold . . . . . . . . . . . . . . . . . . . . $28,364 $28,291 $28,556
% change compared with prior period. . . . . . . . . . . . . . . . . . — (1)%
Gross Margin percentage. . . . . . . . . . . . . . . . . . . . . . . . . . . . . . 27.4% 24.9% 21.8%
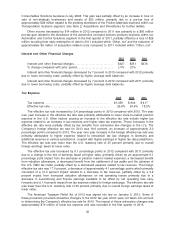
Cost of products and services sold increased by $73 million in 2013 compared with 2012
principally due to an estimated increase in direct material costs of approximately $585 million and
indirect material costs of approximately $115 million (driven by higher sales volume and acquisitions)
and increased repositioning and other charges of approximately $140 million partially offset by a
decrease in pension expense of approximately $760 million, primarily driven by the $650 million
decrease in the pension mark-to-market adjustment allocated to cost of products and services sold
(approximately $30 million in 2013 versus approximately $680 million in 2012).
Gross margin percentage increased by 2.5 percentage points in 2013 compared with 2012
principally due to lower pension expense (approximately 2.0 percentage point impact primarily driven
by the decrease in the pension mark-to-market adjustment allocated to cost of products and services
28